About this app
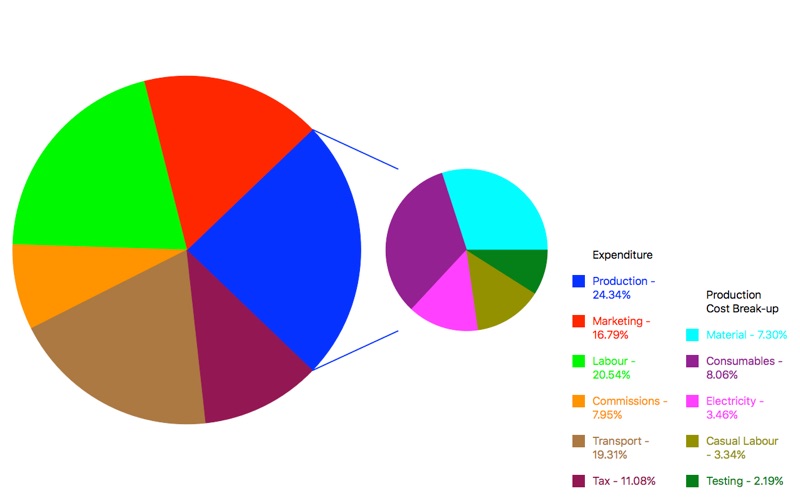
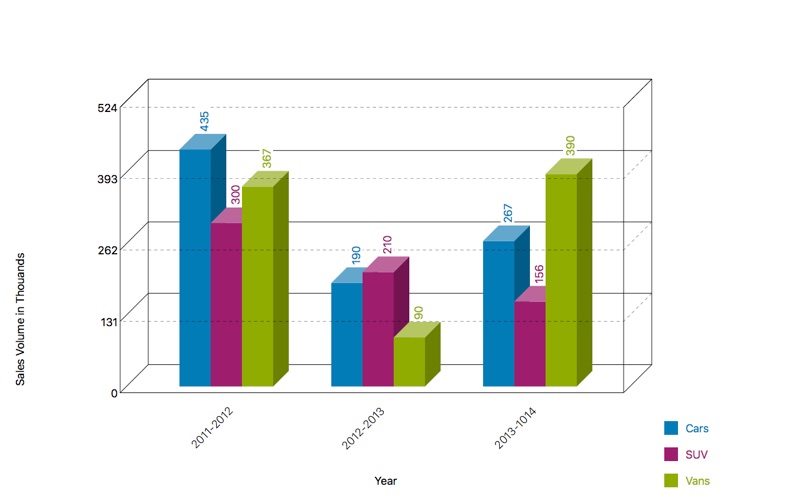
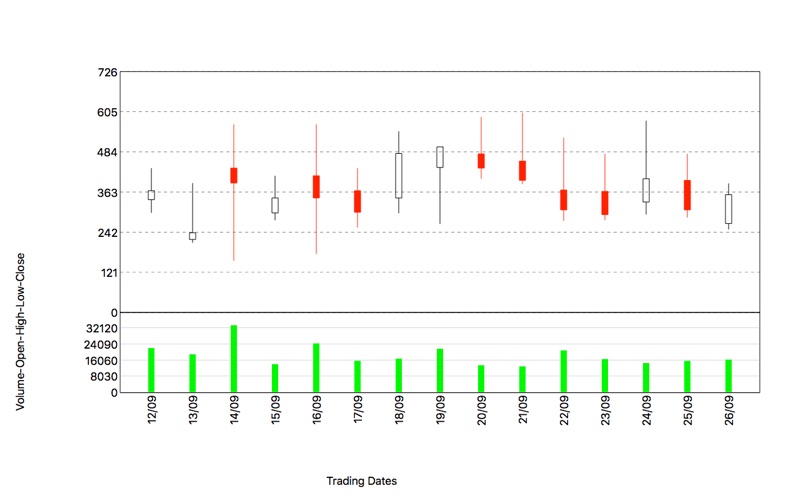
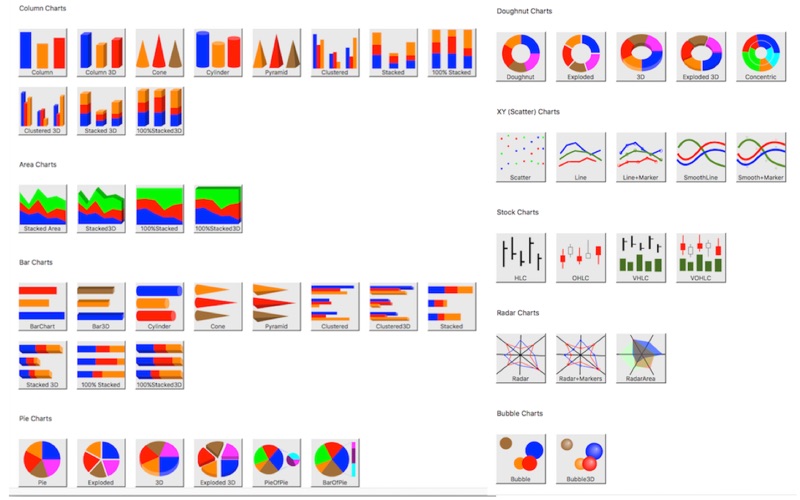
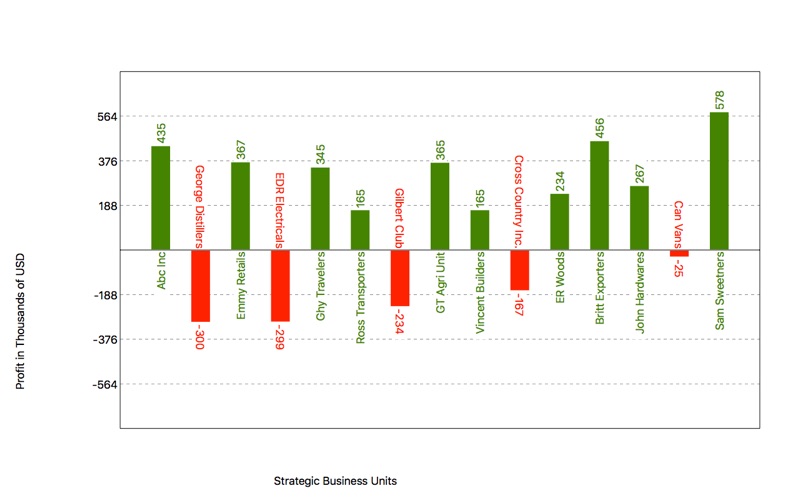
Business Charts App can be used to make the following types of charts:- Column charts 1.Column 2D 2.Column 3D 3.Cylinder 4.Cone 5.Pyramid 6.Clustered 2D 7.Clustered 3D 8.Stacked 2D 9.100% Stacked 2D 10.Stacked 3D 11.100% Stacked 3D Area charts 1.Stacked 2D 2.100% Stacked 2D 3.Stacked 3D 2.100% Stacked 3D Bar charts 1.Bar 2D 2.Bar 3D 3.Cylinder 4.Cone 5.Pyramid 6.Clustered 2D 7.Clustered 3D 8.Stacked 2D 9.100% Stacked 2D 10.Stacked 3D 11.100% Stacked 3D Pie charts 1.Pie 2D 2.Exploded Pie 2D 3.Pie 3D 4.Exploded Pie 3D 5.Pie Of Pie 6.Bar Of Pie XY (scatter) charts 1.Scatter 2.Line 3.Line With Markers 4.Smooth Line 5.Smooth Line With Markers Doughnut charts 1. Doughnut 2D 2.Exploded Doughnut 2D 3. Doughnut 3D 4.Exploded Doughnut 3D 5.Concentric Doughnuts Stock charts 1.High-Low-Close 2.Open-High-Low-Close 3.Volume-High-Low-Close 4.Volume-Open-High-Low-Close Radar charts 1.Radar 2.Radar With Markers 3.Radar Area Bubble charts 1. Bubble 2D 2. Bubble 3D The following Properties can be adjusted by the user:- 1.Chart Width 2.Chart Height 3.Base Value(if applicable) 3.Number of Grids(if applicable) 4.Grid Increment(if applicable) 5.Font size and text Colour 6.Line/Item Width(if applicable) 7.Values Display 7.Grid Display(if applicable) The user can save the charts. The user can read or edit saved charts. The user can export the chart as a picture or pdf.
Latest release
What’s New
Updated for Mac OS X 11.5 and above.
Audience growth
Ratings growth
Baseline captured. Growth appears after the crawler observes a changed rating count.
Momentum comes from crawler snapshots for the tracked storefront. “Viral growth signal” means unusually fast recent rating gains; it is an indicator, not download data.
Price tracking
Price intelligence
First snapshot captured. The trend line starts after the next crawler price observation.
- First observed Aug 8, 2026 · 2:27 PM $1.99
Screenshots