About this app
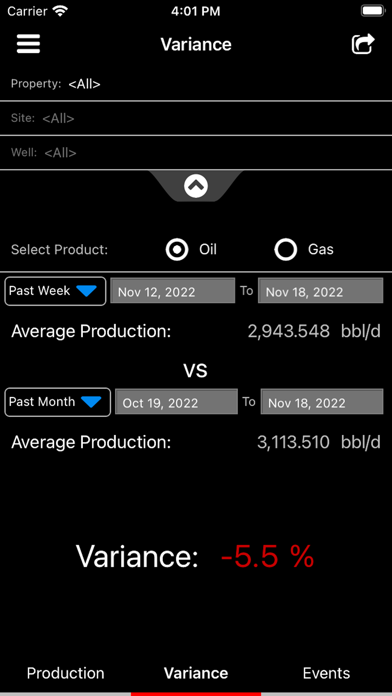
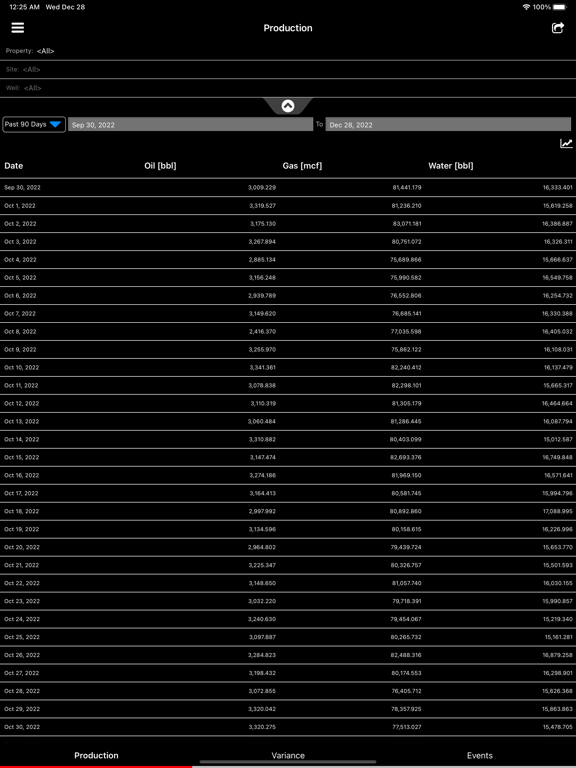
The S&P Global FieldDIRECT® Dashboard enables S&P Global FieldDIRECT® subscribers to monitor their FieldDIRECT® project’s production. The app allows users to view their production, variance, downtimes, and equipment failures as data comes into the FieldDIRECT® database. S&P Global FieldDIRECT® users can view their production from the project, site, and well levels in a table or chart view. The production and various data sets related to production can be graphed on a linear or log scale. Variance can be calculated at all levels based on user set timeframes. Downtime records and Equipment Failure records can also be viewed at all levels. The app allows S&P Global FieldDIRECT® users to view the pertinent production information regarding certain wells or areas at their fingertips from anywhere they have cellular data coverage or access to WiFi.
Latest release
What’s New
-Removed privacy message pop up box
Audience growth
Ratings growth
Baseline captured. Growth appears after the crawler observes a changed rating count.
Momentum comes from crawler snapshots for the tracked storefront. “Viral growth signal” means unusually fast recent rating gains; it is an indicator, not download data.
Price tracking
Price intelligence
First snapshot captured. The trend line starts after the next crawler price observation.
- First observed Aug 31, 2026 · 7:28 AM Free
Screenshots