About this app
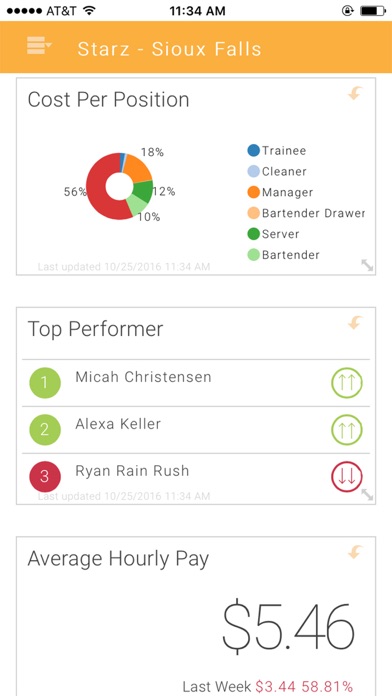
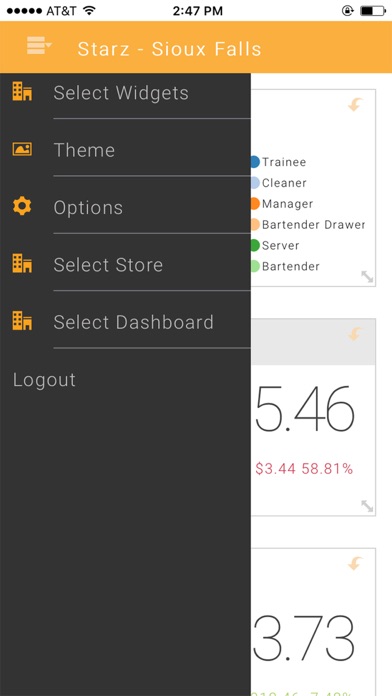
The HotSchedules Dashboard provides at-a-glance information to help you make informed decisions about your restaurant. Customize your view to display the data that matters most to you. The HotSchedules Dashboard is a dynamic framework that allows for data visualization from internal and external data sources. Your dashboard will be automatically updated with the data that you want to see most, such as daily sales, speed of service or trending menu items. Application comes with 3 dashboards with setup widgets LABOR DASHBOARD • Labor % of Sales • Total Labor Cost • Average Hourly Pay • Cost Per Position • Top Performer • Total Labor Cost • Hours Worked SALES DASHBOARD • Net Total Sales • Menu % of Sales • Revenue STORE DASHBOARD • Agent manager • Employee Schedule • Menu Trending • Speed of Service • Google Places • Yelp • Weather The widgets can be customized at any time and linked to additional information. Not only can you share the Dashboard with other team members, but each user also gets to customize their view to display information that is interesting to them. Download and customize your Dashboard today!
Latest release
What’s New
This update from Apple will improve the functionality of this app. No new features are included. bug fixes
Audience growth
Ratings growth
Baseline captured. Growth appears after the crawler observes a changed rating count.
Momentum comes from crawler snapshots for the tracked storefront. “Viral growth signal” means unusually fast recent rating gains; it is an indicator, not download data.
Price tracking
Price intelligence
First snapshot captured. The trend line starts after the next crawler price observation.
- First observed Aug 5, 2026 · 11:56 AM Free
Screenshots