About this app
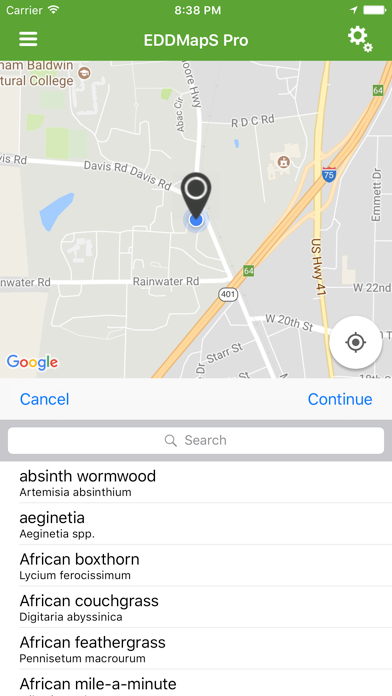
EDDMapS Pro – Professional Invasive Species Mapping & Management EDDMapS Pro is the powerful mobile tool for biologists, land managers, and field teams to report, monitor, prioritize, and combat invasive species effectively. Key Features: • Report & Submit Observations — Create and submit detailed reports with GPS, photos, status (Positive, Negative, Treated, Eradicated), and notes. • Download Datasets — Pull county-level or custom datasets of observations for offline review and planning. • Record Revisits & Contests — Navigate back to sites for updates, contest inaccurate records, or (as a verifier) approve submissions directly in-app. • Photo Projects for Time-Series Monitoring — Establish projects to capture consistent photos over time; the first image serves as a transparent overlay guide for precise alignment on follow-up visits. • Monitoring Zones — Access and use custom forms set up on eddmaps.org for location-specific monitoring protocols. • Project Area Boundary Overlays — Import and load KML files to display property lines, management units, or other boundaries directly on the map for better spatial context. • SIIPA Integration — Access and utilize Spatial Invasive Infestation and Priority Analysis (SIIPA) data and tools to help prioritize treatment areas based on infestation patterns and management goals. • Offline Maps & Workflow — Download map imagery for no-service areas; reports queue locally for users to upload when convenient. • Customizable Views — Filter species lists, toggle report types, and tailor the experience to your workflow. All data syncs seamlessly with the national EDDMapS database (eddmaps.org), supporting real-time distribution mapping, early detection, and collaborative invasive species control across states. Free for qualified professionals—empower your invasive species management today!
Latest release
What’s New
• Updated Image capture and selection to use a more modern approach and save EXIF Data for more accuracy of report information. For any questions, feedback, or suggestions, please use the in-app feedback feature or email us at bugwood@uga.edu.
Audience growth
Ratings growth
Baseline captured. Growth appears after the crawler observes a changed rating count.
Momentum comes from crawler snapshots for the tracked storefront. “Viral growth signal” means unusually fast recent rating gains; it is an indicator, not download data.
Price tracking
Price intelligence
First snapshot captured. The trend line starts after the next crawler price observation.
- First observed Aug 16, 2026 · 9:30 AM Free
Screenshots