About this app
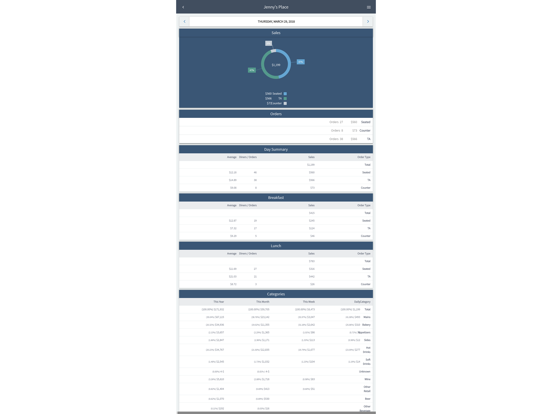
Using advance analytics, the Chef allows restaurant operators to manage their day-to-day operations while using real-time data analysis from the Tabit cloud-based solution. The Chef dashboard shows live data of key performance indicators such as sales, refunds, compensations, discounts and labor cost in an intuitive and user-friendly way. View today’s sales comparison to past dates, compare between months and years. View performance ranking and projected forecast for current month. Ease of access to data and drill down capabilities, starting from a yearly view down to the single check level. Enjoy!
Latest release
What’s New
Enhanced login and performance optimizations.
Audience growth
Ratings growth
Baseline captured. Growth appears after the crawler observes a changed rating count.
Momentum comes from crawler snapshots for the tracked storefront. “Viral growth signal” means unusually fast recent rating gains; it is an indicator, not download data.
Price tracking
Price intelligence
First snapshot captured. The trend line starts after the next crawler price observation.
- First observed Aug 13, 2026 · 4:24 PM Free
Screenshots