About this app
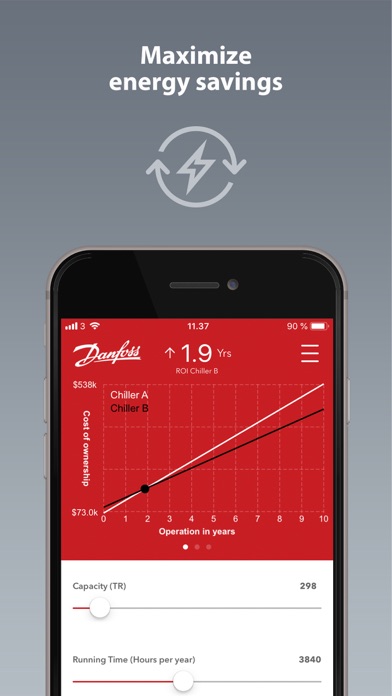
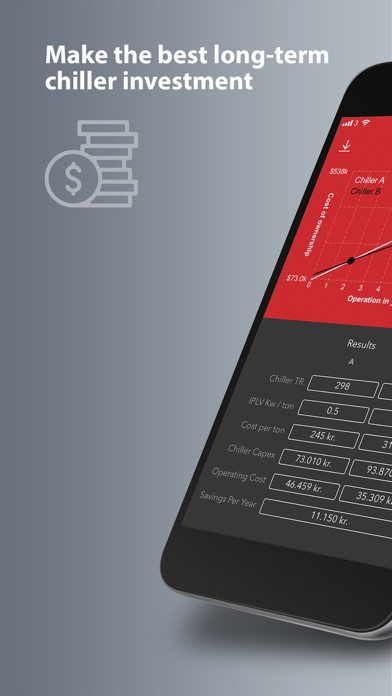
Purchasing a chiller for an office, school, hospital, data center, or other large building is a complex decision with far-reaching consequences. You not only need to consider the initial investment and installation parameters, but also think long-term to keep monthly energy costs as low as possible and minimize environmental impact. The Danfoss ChillerROI app simplifies the decision-making process by allowing you to estimate return on investment (ROI) using a few pieces of basic information. Simply enter the parameters into the app, and you’ll get side-by-side comparison that displays the expected long- and short-term costs. Then, you can choose the best chiller for the situation. You can also export the results for use in your own reports. The ChillerROI app calculates ROI based on: • Chiller efficiency data (IPLV) • Capex cost ($/ton) • Chiller capacity • Initial cost • Local electrical rates • Expected hours of operation Whether you are installing a chiller at your own facility or sharing the benefits of your chiller system with a customer, the ChillerROI app helps make the decision process quick and easy. Download it today for free to get started. ChillerROI App belongs to Danfoss A/S. How to Use To get started, input the baseline data for the project, including capacity, running time (hours per year), and cost of energy. The data can be changed by sliding the target to the correct value. You can also change the value manually by pressing and holding the default value for a few seconds. This will cause the keypad to show up and you can enter the value. Next, input the efficiency (IPLV) and Capex cost ($/ton) for chiller A. Chiller A should be the least efficient of the two models being compared. Finally, the same information should be entered for chiller B, the more efficient chiller. The app will then display the return on investment (ROI) in graphical form at the top of the screen. You can also view the data in a summary report by selecting the menu located in the top right of the screen and then selecting “export.” You can switch the display to metric units in this section as well. Disclaimer ChillerROI (“the Application”) is provided on an “as is” and “as available” basis for the intended purposes as determined by Danfoss only and any use hereof is at the user’s sole risk. The Application and results and information generated thereby cannot substitute technical advice but must be verified by the user, they are not promises and should not be relied on as accurate data or analyses. Danfoss disclaims all warranties and conditions regarding the Application, whether express, implied, or statutory, including, but not limited to, conditions of merchantability, satisfactory quality, and fitness for a particular purpose, accuracy and non-infringement of third parties’ rights. Danfoss does not warrant that the Application will meet your requirements or that the operation hereof will be uninterrupted or error-free. To the extent not prohibited by law, in no event shall Danfoss be liable for any direct, special, indirect or consequential damages, whatsoever, including, without limitation, damage to property, damages for loss of savings or profits, or loss of data arising out of any use of the Application. Please visit https://www.danfoss.com/en/products/compressors/dcs/turbocor for more information about Turbocor compressors. Please review the Danfoss Privacy Policy: https://www.danfoss.com/en/terms/privacy/ ChillerROI support, please email product.support@danfoss.com
Latest release
What’s New
Updated App Store content
Audience growth
Ratings growth
Baseline captured. Growth appears after the crawler observes a changed rating count.
Momentum comes from crawler snapshots for the tracked storefront. “Viral growth signal” means unusually fast recent rating gains; it is an indicator, not download data.
Price tracking
Price intelligence
First snapshot captured. The trend line starts after the next crawler price observation.
- First observed Aug 14, 2026 · 3:17 PM Free
Screenshots