About this app
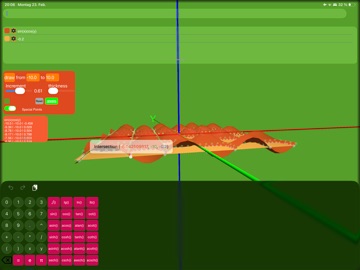
Graph is your powerful tool for visualizing mathematical functions—ideal for school, university, and anyone who wants to experience mathematics firsthand. 2D and 3D Display Seamlessly switch between classic 2D views and stunning 3D surface rendering. Graph functions with one or two variables and explore them interactively by zooming, panning, and rotating. Over 24 Mathematical Functions Trigonometric, hyperbolic, logarithmic, and other functions are at your disposal—including sin, cos, tan, ln, sqrt, and many more. Complex expressions with nested structures are reliably evaluated. Automatically Detect Special Points Zeros, y-intercepts, intersections, and points of tangency are automatically calculated and highlighted on the graph—so you can see the important properties of your functions at a glance. Individual Settings for Each Function Adjust the color, line thickness, resolution, and domain for each function individually. Graph multiple functions simultaneously and compare them directly. Save and Load Scenes Save all your work as a scene—including all functions, settings, colors, and camera positions. Reload saved scenes at any time and continue working seamlessly. Value Table View function values anywhere and analyze the behavior of your functions in detail. Thoughtful Design Color-coded input validation, an integrated mathematical keyboard, and a modern glass-effect design ensure a pleasant user experience. Highlights at a Glance: 2D and 3D Function Display Over 24 Mathematical Functions Automatic Detection of Special Points Customizable Color and Display Settings Save and Load Scenes Value Table Mathematical Keyboard
Latest release
What’s New
Automatic detection of special points.
Audience growth
Ratings growth
Baseline captured. Growth appears after the crawler observes a changed rating count.
Momentum comes from crawler snapshots for the tracked storefront. “Viral growth signal” means unusually fast recent rating gains; it is an indicator, not download data.
Price tracking
Price intelligence
First snapshot captured. The trend line starts after the next crawler price observation.
- First observed Aug 24, 2026 · 11:30 PM $0.99
Screenshots