About this app
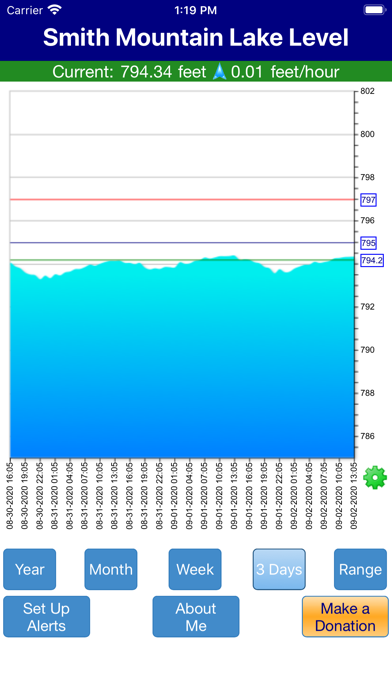
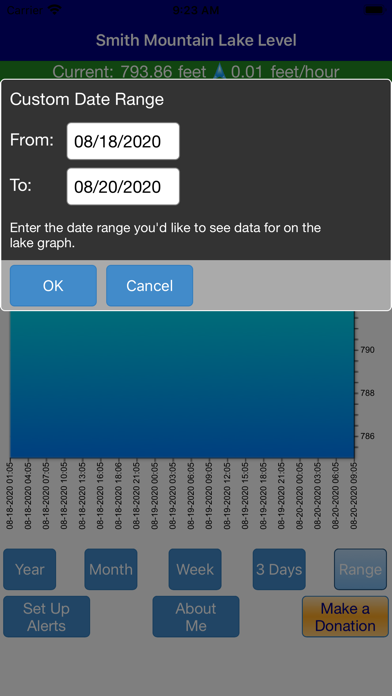
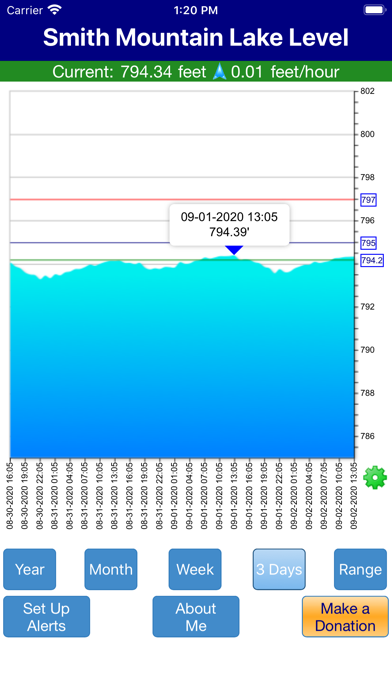
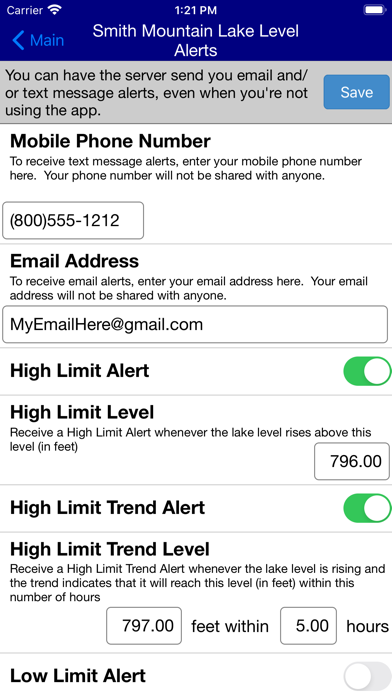
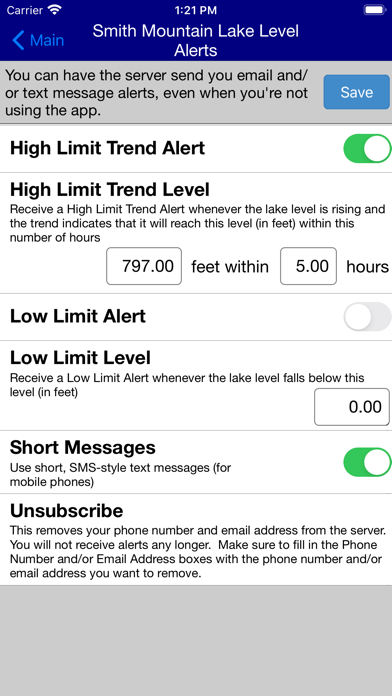
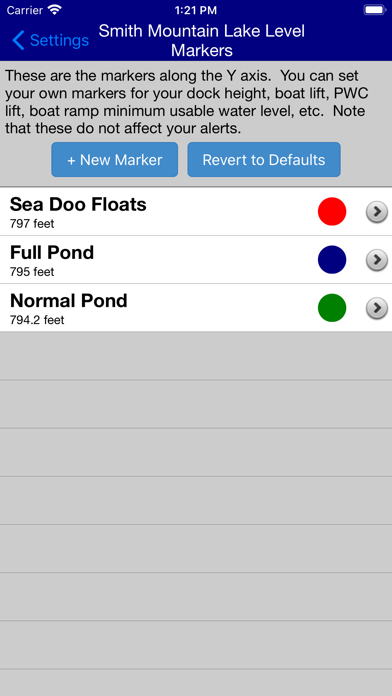
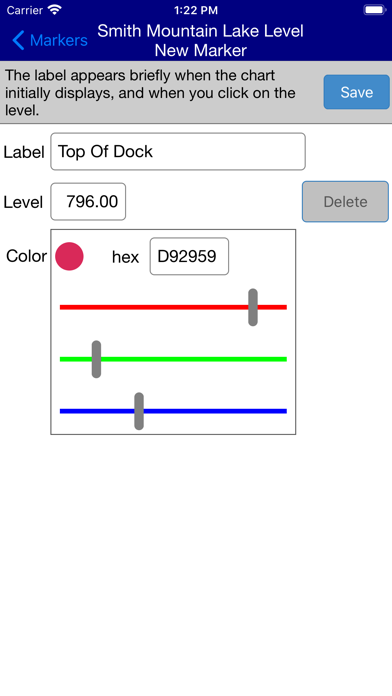
Smith Mountain Lake level graph, updated hourly. Also shows current level and trend (rise or fall rate), and now water temperature! Brought to you by the author of SmithMountainLakeLevel.com. Select date ranges: 3 days, 1 week, 1 month, 1 year, or a custom range. Sign up for free text (SMS) and/or email alerts. Tap anywhere in the graph to see the exact date, time, and level at that moment. Custom Level Markers! Define your own colored level lines for the chart. Access this feature from the new Settings screen. Tap any special level (any that are surrounded by a blue box) on the Y axis (right side) to see its meaning.
Latest release
What’s New
Version 2.0 ----------- - Water Temperature has been added! - Historical Extremes has been added to the Settings screen. - Better scaling on Tablets, and better arrangement of controls on devices of all sizes, to avoid scrolling. - Landscape orientation is now supported.
Audience growth
Ratings growth
Baseline captured. Growth appears after the crawler observes a changed rating count.
Momentum comes from crawler snapshots for the tracked storefront. “Viral growth signal” means unusually fast recent rating gains; it is an indicator, not download data.
Price tracking
Price intelligence
First snapshot captured. The trend line starts after the next crawler price observation.
- First observed Aug 20, 2026 · 10:42 PM Free
Screenshots