About this app
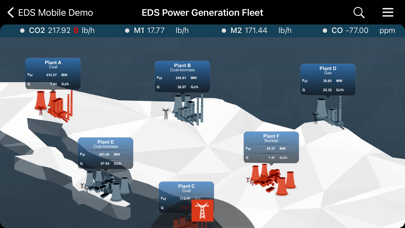
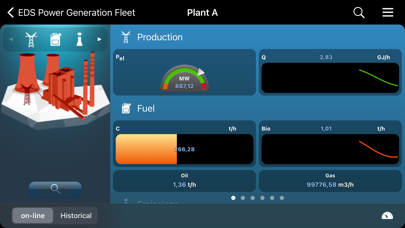
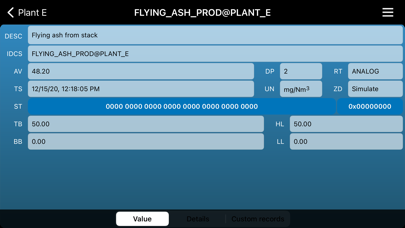
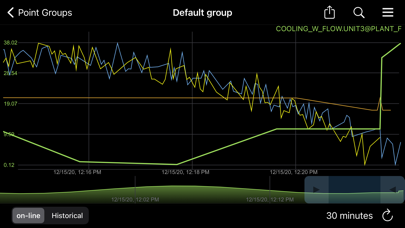
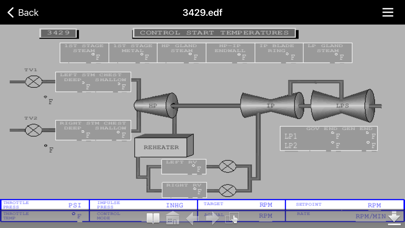
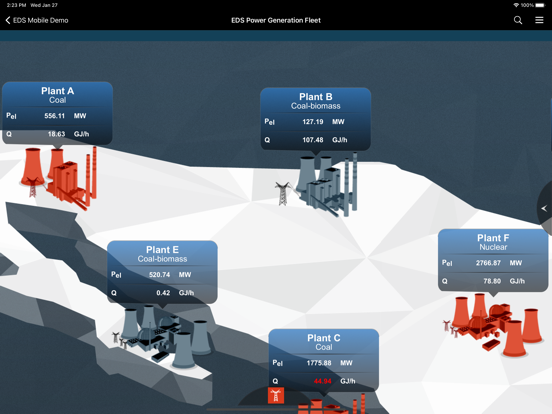
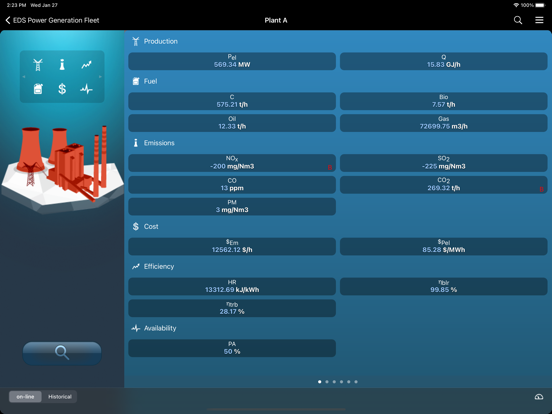
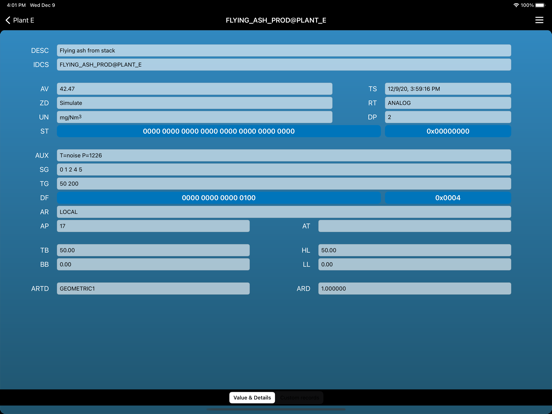
Note: EDS Viewer App is pre-configured to connect to EDS Server virtual plant for real-time and historical data. To design your own dashboards using data from your control system please visit our App Support page and request an EDS Server installation. EDS Viewer turns your iPad or iPhone into a real time mobile decision-support asset by bringing all critical data wherever you go. Use Multi-Touch gestures to navigate through a multi-level view layout reflecting your company’s organization structure. Compare plant’s performance side-by-side on a macro level using key performance indicators (KPIs) or drill down to data as precise as the meaning of a single bit in a control system’s register. React to live alarms generated from calculations, measurements, or predictive alerts imported from the control system. Display high fidelity process diagrams representations of industrial automation systems updated online. Analyze your plant’s operational history by reviewing and plotting historical events and data. Compare plants’ performance online Use the plant grouping tool to define the scope of analysis Use various group filters to select interesting information Take advantage of the multi-panel scrolling to compare performance Navigate to lower level detailed views to get a better picture of the current status Explore your enterprise data in the way you like most: -Use a map display to locate the plant -Access assets unit by unit by tapping and scrolling screens -Use filtered lists to merge data from different locations -Display groups of measurements and the KPI you are interested in -Access detailed information and plot values at any time Keep current or explore trends in operation -Access live process diagrams -Use engineering tools to access hardware-level information, timestamps and statuses -Use status word explanation tooltips for multi-bit registers Don’t miss a bit in the big picture. -Take advantage of alarm propagation to get to its source -Display live alarms -Review historical alarms and events -Display live and historical plots for any value
Latest release
What’s New
- Added the ability to select the default time range for the trend plot - Bug-fixes
Audience growth
Ratings growth
Baseline captured. Growth appears after the crawler observes a changed rating count.
Momentum comes from crawler snapshots for the tracked storefront. “Viral growth signal” means unusually fast recent rating gains; it is an indicator, not download data.
Price tracking
Price intelligence
First snapshot captured. The trend line starts after the next crawler price observation.
- First observed Aug 23, 2026 · 11:14 AM Free
Screenshots