About this app
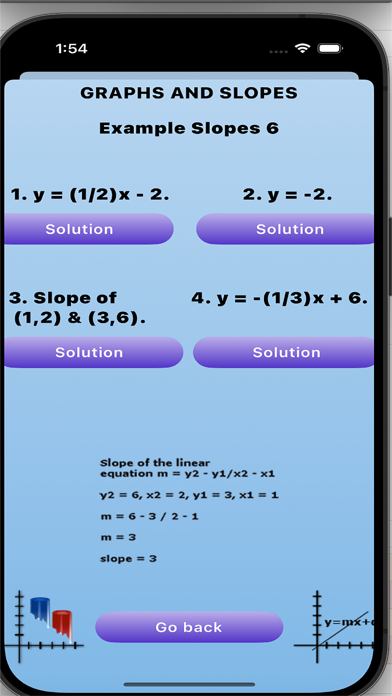
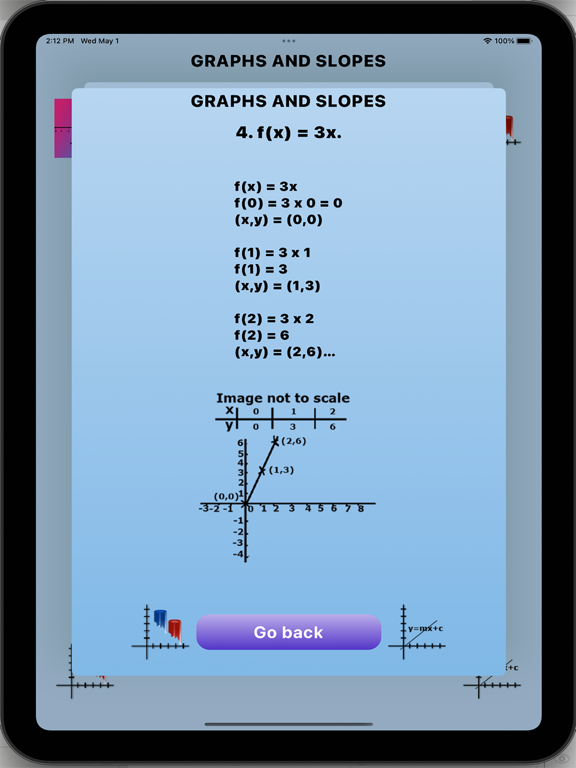
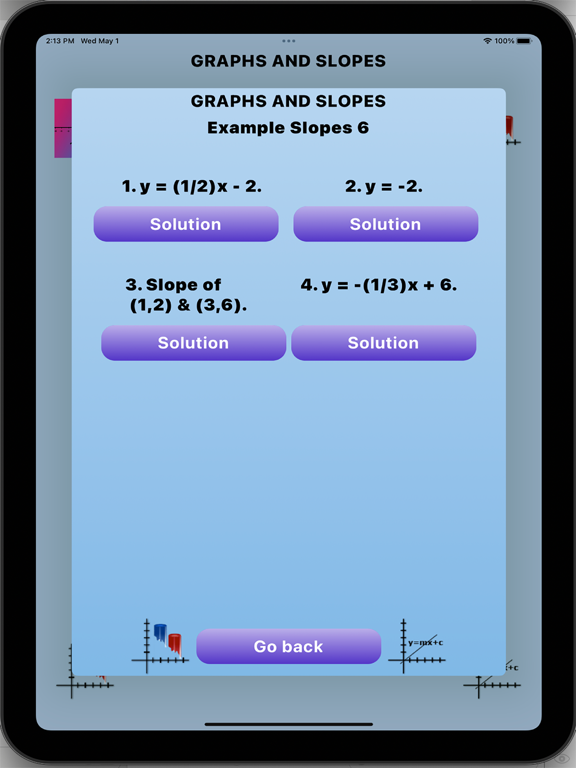
"Graphs and Slopes" explains the concept of linear equations in Math. This app also explains the non linear equation in a nutshell. This app categorizes the graph concept into bite size information. The core points like y-intercepts, slopes and graph plotting are explained with examples. Review questions at the end of the category, asks questions pertaining to these concepts and even has the option to provide hints and answers to reinforce your understanding. Touch the images to zoom-in and out.
Latest release
What’s New
Minor changes.
Audience growth
Ratings growth
Baseline captured. Growth appears after the crawler observes a changed rating count.
Momentum comes from crawler snapshots for the tracked storefront. “Viral growth signal” means unusually fast recent rating gains; it is an indicator, not download data.
Price tracking
Price intelligence
First snapshot captured. The trend line starts after the next crawler price observation.
- First observed Sep 11, 2026 · 6:53 PM $2.99
Screenshots