About this app
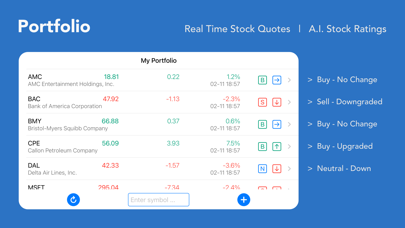
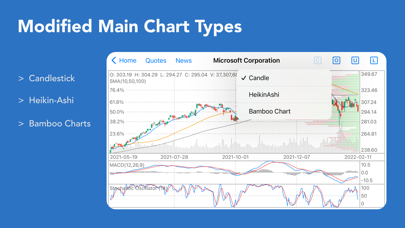
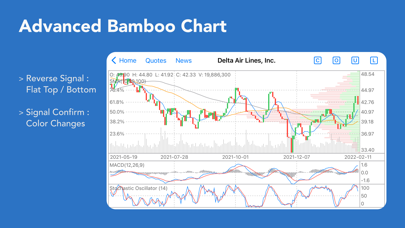
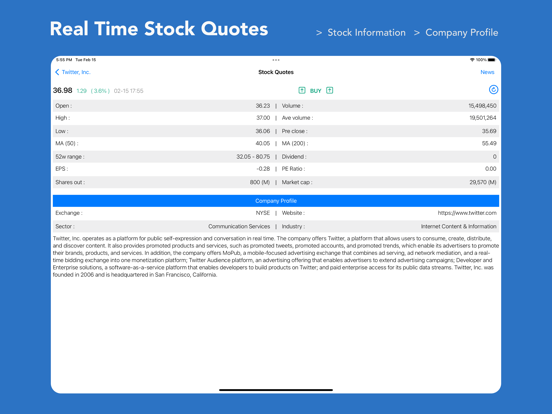
Stock Charts and Quotes US Stocks Technical Analysis Charts, Quotes and stock ratings, company news, includes NYSE, NASDAQ and AMEX stocks. Features: 1. Stock technical analysis ratings: Buy, Sell or Neutral. 2. Main Charts: three types, Candlestick Charts, Heikin-Ashi Charts and Bamboo Charts. Heikin-Ashi Charts: when bar colour changes, the trend reverses. Bamboo Charts: Flat top or bottom is the sign of reverse, if bar colour changes, the reverse is confirmed. 3. 10+ Stock analysis overlays: Bollinger Bands, Chandelier Exits, Moving Averages, Keltner Channels, Price Channels, Support and Resistance lines, and much more ... 4. 20+ Technical analysis indicators: Accumulation Distribution Line, Aroon Up and Down , Aroon Oscillator , Average Directional Index (ADX), Average True Range (ATR) , Commodity Channel Index (CCI), Chaikin Money Flow (CMF), Chaikin Oscillator, Coppock Curve, Full Stochastics, MACD, Mass Index, Money Flow (MFI), On Balance Volume (OBV), %B Indicator, Rate of Change (ROC), Relative Strength Index (RSI), Deviation Oscillator, Sigma Oscillator, Williams %R (%R), and much more ... 5. Stock real-time quotes, stock rating and company profile. 6. Latest company headline news. 7. Free.
Latest release
What’s New
updated to the latest SDKs and UI improvements.
Audience growth
Ratings growth
Baseline captured. Growth appears after the crawler observes a changed rating count.
Momentum comes from crawler snapshots for the tracked storefront. “Viral growth signal” means unusually fast recent rating gains; it is an indicator, not download data.
Price tracking
Price intelligence
First snapshot captured. The trend line starts after the next crawler price observation.
- First observed Aug 19, 2026 · 8:17 PM Free
Screenshots