About this app
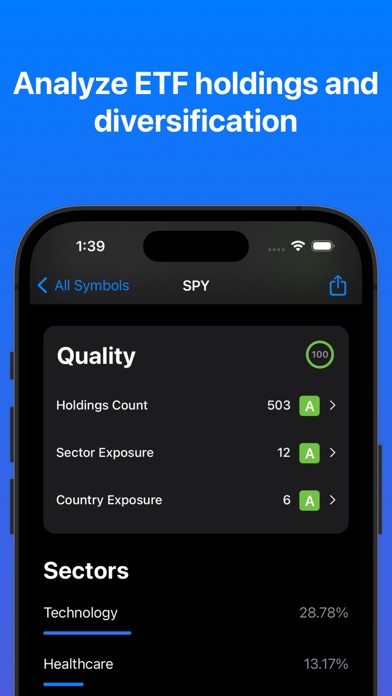
Understand a stock’s fundamentals in seconds. Stock Analyzer turns 19 valuation, quality, dividend, and volatility metrics into clear A–E ratings and category scores. Research more than 30,000 stocks and ETFs without digging through spreadsheets. ANALYZE FUNDAMENTALS • Review DCF, PEGY, P/E, ROIC, ROE, dividend yield, beta, and more • See whether valuation metrics indicate a stock may be under- or overvalued • Open formulas and plain-language explanations for every metric • Explore financial reports with clear charts ON-DEVICE AI SUMMARY • Where available, get a concise explanation of precomputed stock metrics • Review Strengths, Watchouts, and areas to Explore Further • AI runs on device; category scores remain rule-based • Requires iOS 26 and a supported Apple Intelligence device, region, and locale • When unavailable, deterministic Key Takeaways summarize the same precomputed facts • The summary is educational and is not personalized investment advice RESEARCH ETFs • Explore holdings, countries, and sectors • Review expense ratios and ETF price-to-earnings ratios BUILD YOUR WATCHLIST • Follow companies and organize them into groups • Compare performance with the S&P 500, Nasdaq, and Dow Jones • Use Lock Screen and Home Screen widgets • Receive notifications when earnings reports become available DISCOVER IDEAS • Explore trending symbols and market activity • Search more than 30,000 stocks and ETFs • Revisit symbols shared with you by friends FREE TO START The free version supports up to five watchlist stocks, 20 company analyses per day, and a limited trending view. Stock Analyzer Pro unlocks unlimited analysis, unlimited watchlists, complete trending results, and watchlist statistics. Stock Analyzer is an educational research tool, not investment advice. Always do your own research before making investment decisions. Terms: https://www.stock-analyzer.app/terms/ Privacy: https://www.stock-analyzer.app/privacy/
Latest release
What’s New
Stock analysis is now easier to understand. On supported devices, on-device AI writes a concise thesis and explains Strengths, Watchouts, Missing Context, and the latest quarterly financials. Everything stays grounded in Stock Analyzer’s deterministic scores and supplied data; scores and valuation calculations remain unchanged.
Audience growth
Ratings growth
Baseline captured. Growth appears after the crawler observes a changed rating count.
Momentum comes from crawler snapshots for the tracked storefront. “Viral growth signal” means unusually fast recent rating gains; it is an indicator, not download data.
Price tracking
Price intelligence
First snapshot captured. The trend line starts after the next crawler price observation.
- First observed Sep 1, 2026 · 3:01 PM Free
Screenshots