About this app
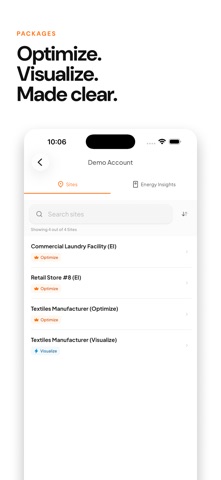
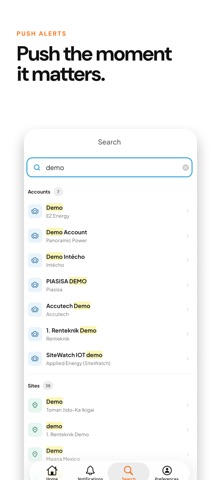
Power Radar puts your energy data where the work happens — in your hand, in real time. Built on Panoramic Power's circuit-level submetering, Power Radar shows exactly what every site and every major system is consuming, the moment it happens. No waiting for the utility bill. No guessing which load spiked overnight. WHAT YOU CAN DO See live demand. A real-time gauge shows current draw and cost the instant you open the app. Track the trend. Last-7-days power and cost charts make it clear whether you're improving or drifting. Drill into Time View. Move through the day, hour by hour, to find exactly when consumption climbed. Catch your largest consumers. Rank the systems and circuits driving your load, so you fix the ones that matter. Compare across sites. Manage a portfolio from one screen — every location, side by side. Act on alerts. Push notifications flag anomalies and threshold breaches, and tap straight through to the detail. Log events. Note a shutdown, a shift change, or a maintenance window and tie it back to what the data did. OPTIMIZE vs. VISUALIZE Optimize unlocks the full real-time experience: push notifications, customizable dashboards, Time View, and event logging. Visualize-only accounts can upgrade in seconds. BUILT FOR THE FLOOR Power Radar is made for the people who run facilities — energy and operations managers who need answers now, and leaders who need to see efficiency across every site at once. Light, Dark, and System themes keep it readable on the floor or in the office. Power Radar requires a Panoramic Power account.
Latest release
What’s New
PowerRadar 3.0.1 • Dashboards - view and switch between the dashboards you built on the web, with all your widgets • Site Alerts - filter, open, and review alerts per site • Inventory & Heatmap - browse meters/sensors and spot usage patterns hour-by-day • Time View - richer device tree + a new Normalize (%) comparison mode • Light mode is now the default (Light / System / Dark in Preferences) • Refreshed design, weather in your regional units, and reliability fixes
Audience growth
Ratings growth
Baseline captured. Growth appears after the crawler observes a changed rating count.
Momentum comes from crawler snapshots for the tracked storefront. “Viral growth signal” means unusually fast recent rating gains; it is an indicator, not download data.
Price tracking
Price intelligence
First snapshot captured. The trend line starts after the next crawler price observation.
- First observed Aug 13, 2026 · 3:50 AM Free
Screenshots