About this app
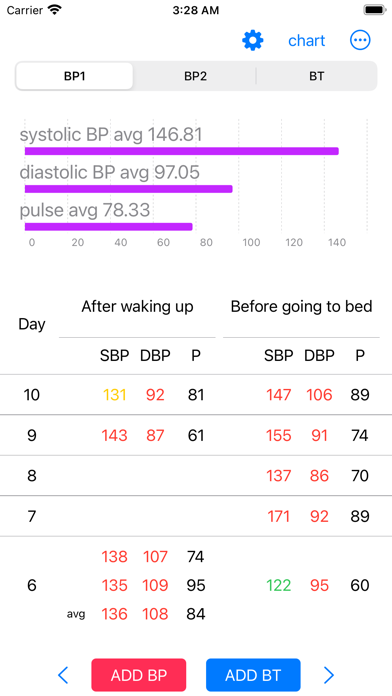
It is an application for recording the measured blood pressure. You can also record the measured body temperature. ・Blood pressure registration procedure 1. Tap the "Blood pressure" button at the bottom 2. Select measurement timing "before waking up" or before going to bed 3. Enter the systolic blood pressure, diastolic blood pressure, and pulse, and tap OK. The current date and time will be set automatically. You can change the date and time later. ・Temperature registration procedure 1. Tap the "Body Temperature" button at the bottom 2. Enter your body temperature and tap OK.The decimal point will be entered automatically. The current date and time will be set automatically. You can change the date and time later. Tap Blood Pressure 1 It displays a blood pressure graph, a bar graph of average blood pressure, and a table of recorded blood pressure. Tap Blood Pressure 2 Graphs of systolic blood pressure, diastolic blood pressure, and pulse rate Displays bar graph of average blood pressure, table of recorded blood pressure. tap the temperature It displays a graph of monthly body temperature, a bar graph of average body temperature, maximum body temperature, minimum body temperature and a table of body temperature. Tap a record in the table Displays the screen for changing/deleting the recorded blood pressure/body temperature. ·graph Tap the "Graph" button on the upper right to display the following menu. blood pressure Graph every day Monthly graph Graph year All graph records body temperature Graph every day Monthly graph Graph year All graph records ・ Transfer model change data For users with the same Apple ID Because the records are stored in iCloud View the same record on your new iPhone/Ipad
Latest release
What’s New
change app screen
Audience growth
Ratings growth
Baseline captured. Growth appears after the crawler observes a changed rating count.
Momentum comes from crawler snapshots for the tracked storefront. “Viral growth signal” means unusually fast recent rating gains; it is an indicator, not download data.
Price tracking
Price intelligence
First snapshot captured. The trend line starts after the next crawler price observation.
- First observed Aug 18, 2026 · 3:06 AM Free
Screenshots