About this app
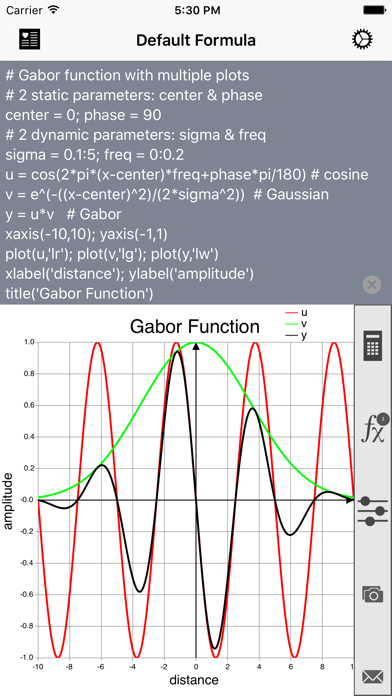
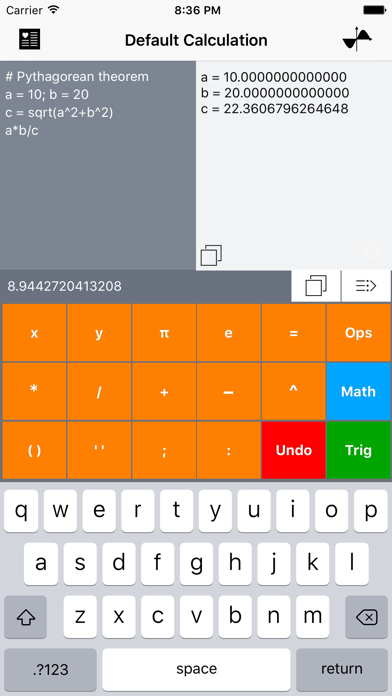
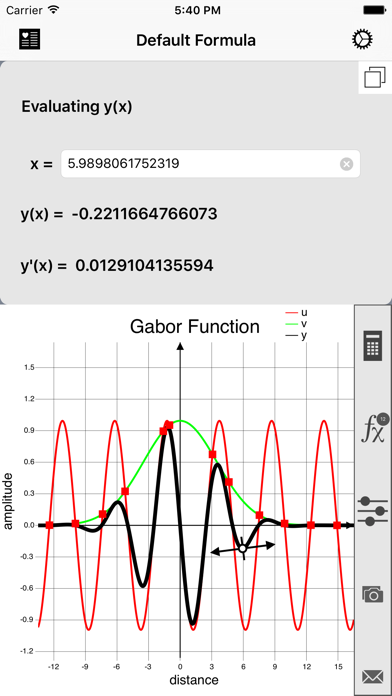
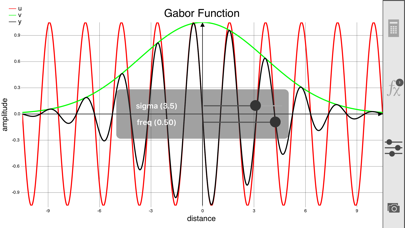
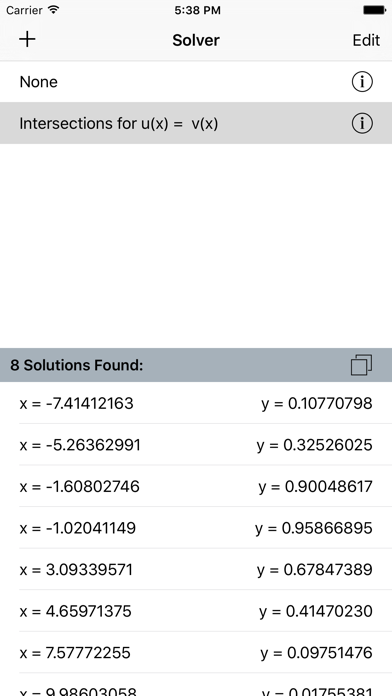
MATH GRAPHING 2.0 is a unique graphing app to plot simultaneously multiple mathematical expressions of arbitrary complexity using static and dynamic variables (including a time variable and random generation functions). It also includes a standard calculator mode that allows simultaneous evaluations of any number of intermediary variables. "Math Graphing" can help students improve their math skills by developing some visual intuition of mathematical expressions or advanced users who need some scientific capabilities only available with expensive desktop software. MATH GRAPHING provides the following functionalities: - Multiple expressions with quasi-unlimited number of variables can be combined to produce simple or complex formulas. - Interactive sliders can be created to visually investigate the role of important parameters on the graphical representation of the formulas. - Trace mode to display coordinates and derivative of marker on selected curve. - Landscape mode for graphing. - Solver tool to solve y = f(x) where x or y are unknown, local/global minima/maxima/extrema or intersections g(x) = f(x). - Formula graphs can be saved to the device's Photos Album and the formulas can be exported through email with embedded graphs. - Add any formula or calculation to your list of favorites (in-app purchase). - Several formulas can be plotted simultaneously in different colors and styles. - Customizable graph appearance: axes labels and ranges, title, curve color and style, ticks number, grid, legends, etc. - A single-precision calculator supporting multiple variables. Example of mathematical expression: # Gabor function with multiple plots # 2 static parameters: center & phase center = 0; phase = 90 # 2 dynamic parameters: sigma & freq sigma = 1:50; freq = 0:0.2 u = cos(2*pi*(x-50)*freq+phase*pi/180) v = e^(-((x-center)^2)/(2*sigma^2)) y = u*v plot(u,'lr'); plot(v,'lg'); plot(y,'lw') xlabel('distance'); ylabel('amplitude') title('Gabor Function') Please visit our "Math Graphing" web page (http://ios.kybervision.com/mathgraphing/) to learn more about "Math Graphing"! About KyberVision Japan LLC: we provide consulting, research and development services in Vision Sciences. We also develop vision-related applications for the iPad/iPhone/iPod Touch platform, that are spin-off products of Psykinematix, our Mac OS X flagship product in the field of Visual Psychophysics. Feel free to subscribe to our newsletter at http://iphone.kybervision.com.
Latest release
What’s New
This update from Apple will improve the functionality of this app. No new features are included. Add a title and values of dynamic variables to tabulated data copied from the solver module Additional functions: Student's t-distribution pdf and Chi-Square Distribution cdf functions Shake the device to reset the axes with a 1:1 aspect ratio Minor bug fixes in interface orientation change
Audience growth
Ratings growth
Baseline captured. Growth appears after the crawler observes a changed rating count.
Momentum comes from crawler snapshots for the tracked storefront. “Viral growth signal” means unusually fast recent rating gains; it is an indicator, not download data.
Price tracking
Price intelligence
First snapshot captured. The trend line starts after the next crawler price observation.
- First observed Aug 20, 2026 · 2:36 AM Free
Screenshots