About this app
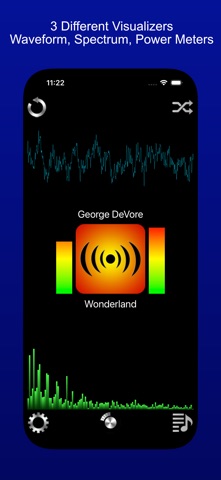
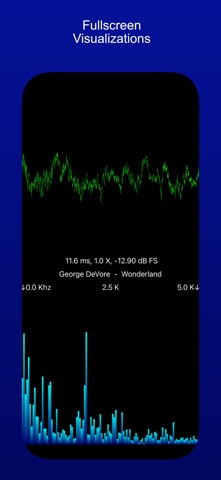
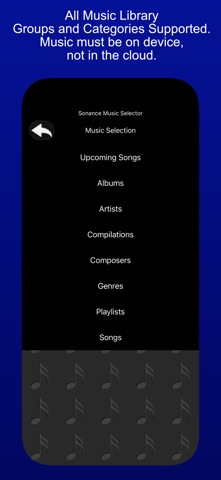
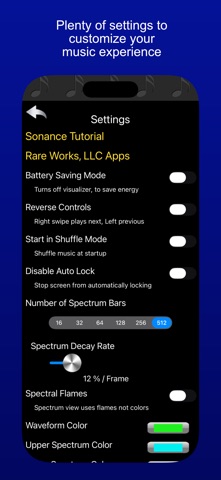
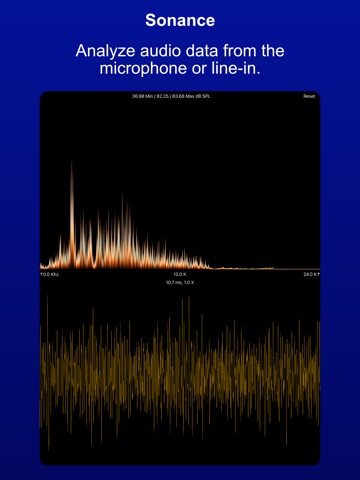
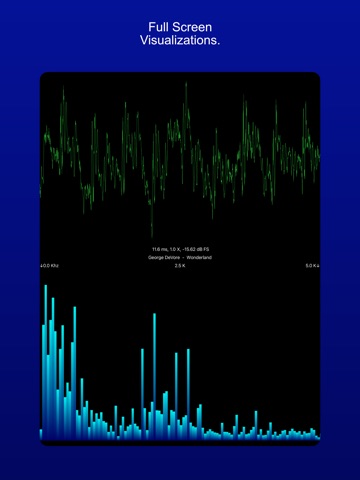
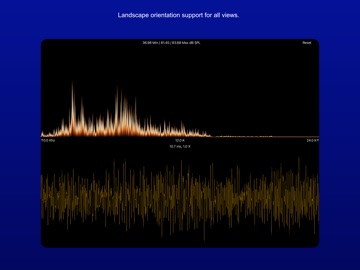
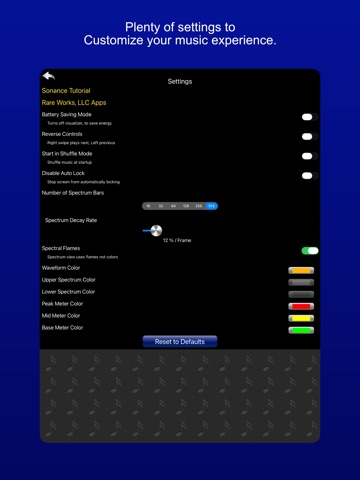
Sonance is a music player, an audio spectrum analyzer, and a decibel meter — see the beat! Sonance plays music that's on your device, and displays waveform and audio spectrum visualizations, plus power level meters, in real time. Sonance has an in-car interface with large buttons and swipe gestures to move between songs. It's easy to use while driving, since it doesn't require much focus to make a desired change — yet it also has entertaining visualizations to enhance the musical experience when you do have a moment to look. Sonance includes an easy-to-use shuffle mode, plus the ability to repeat one song or a queue of chosen songs. A variety of settings let you personalize startup behavior, the user interface, and the visualizer. The visualizer has a full-screen mode with extensive customization via pinch and swipe gestures. Sonance also works great with AirPlay, and the visualizers look great when mirroring your device. MICROPHONE VISUALIZATION Sonance can also visualize input from the microphone — have fun with sound! It analyzes audio from the built-in microphone or an attached external microphone, and displays both the raw input signal and the "frequency bars" produced by spectrum analysis. The input signal appears in the lower view as a waveform; the spectrum appears in the upper view as bars showing the strength of each frequency in the signal. Frequencies range from 0 Hz to 24,000 Hz (24K) — the range of the iPhone and iPad microphone, and roughly the range of human hearing. DECIBEL METER Levels are shown in two metrics. Recorded audio is shown as dB FS (Full Scale), from -120 dB to 0 dB, where 0 dB is the highest possible level. Audio from the internal or an external attached microphone is shown as dB SPL (Sound Pressure Level), from 0 dB to 100 dB. For reference, 120 dB can cause pain, and 140 dB can cause damage. GESTURES Use horizontal and vertical pinches on either display to zoom in and out of the visualization. On the Spectrum display, slide to move the display left and right, letting you see specific frequencies in detail. Pinches are cumulative, so keep pinching! The settings panel lets you reset the app to its defaults at any time, so go ahead and explore sound.
Latest release
What’s New
Performance improvements across all views. Several bug fixes. More accurate decibel meter readings when using the microphone. Update to meet current App Store requirements.
Audience growth
Ratings growth
Baseline captured. Growth appears after the crawler observes a changed rating count.
Momentum comes from crawler snapshots for the tracked storefront. “Viral growth signal” means unusually fast recent rating gains; it is an indicator, not download data.
Price tracking
Price intelligence
First snapshot captured. The trend line starts after the next crawler price observation.
- First observed Aug 19, 2026 · 9:24 PM $0.59
Screenshots