About this app
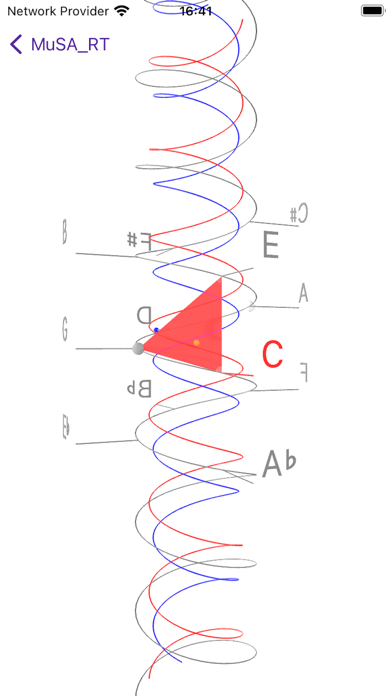
MuSA_RT applies music analysis algorithms rooted in Elaine Chew’s Spiral Array model of tonality, which also provides the 3D geometry for the visualization space. The app analyzes the audio signal received from a microphone to determine pitch names, maintain short term and longterm tonal context trackers, each a Center of Effect (CE), and compute the closest triads (3-note chords) and keys as the music unfolds in performance. The 3D view presents a graphical representations of these tonal entities in context, smoothly rotating the virtual camera to provide an unobstructed view of the current information. These graphics can also be visualized in an experimental Augmented Reality mode on compatible devices.
Latest release
What’s New
This version introduces: - audio file input - streaming of analysis data to/from other MuSA_RT instances - UI tweaks and a modernized logo
Audience growth
Ratings growth
Baseline captured. Growth appears after the crawler observes a changed rating count.
Momentum comes from crawler snapshots for the tracked storefront. “Viral growth signal” means unusually fast recent rating gains; it is an indicator, not download data.
Price tracking
Price intelligence
First snapshot captured. The trend line starts after the next crawler price observation.
- First observed Aug 21, 2026 · 6:26 AM Free
Screenshots