About this app
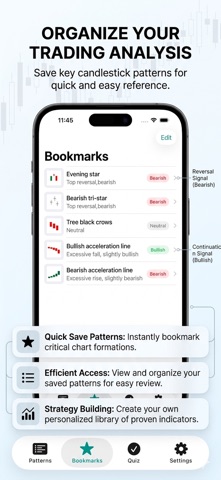
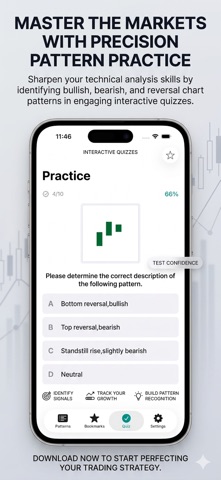
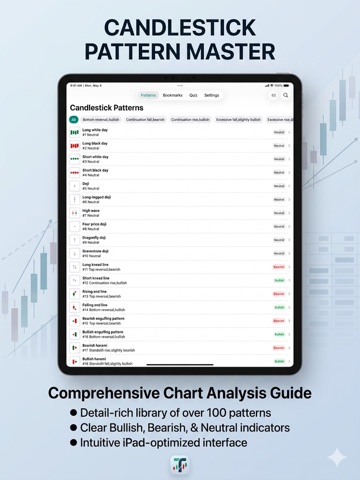
Japanese candlestick charts offer a strategic view in trading. It is one of the most famous technical analysis tools in the world. In the intricate trading game, these candlesticks are the visual trackers of market trends which have been a cornerstone in technical analysis since the 18th century, providing a clear view of price movements in the finance world. Japanese candlestick charts are a must-have in any trader's toolkit. They offer classical signals and patterns of stock trading. Each candle on the chart has a particular meaning, with its body indicating the open and close prices, and the wick showing the high and low. This charting technique is not just a tool for buying and selling stocks; it's a language that speaks volumes about the market's sentiment, whether in a bull or bear market. This app serves as a free guide book, allowing the beginners and the followers to learn Japanese candlestick charting, and practice their trading skills in a risk-free environment before venturing into the real market. Japanese candlestick charting can also serve as a reference and simulators manual to help the stock masters to make informed Alpha strategy and decision in their online stock trading. No matter whether they are managing capital in the Nasdaq, Dow Jones or Chinese stock market, and whether they are short or long. Specific content includes: 1.43 typical pattern graphs are showed in this free version 2.Definition,recognition and explanation of every pattern 3.Exercises training and statistical functions 4.Bookmark function
Latest release
What’s New
- Updated interface and navigation - Improved pattern list, detail pages, and multi-example viewing - Refined search, bookmarks, and quiz flow - Added multiple visual themes - Updated compatibility details
Audience growth
Ratings growth
Baseline captured. Growth appears after the crawler observes a changed rating count.
Momentum comes from crawler snapshots for the tracked storefront. “Viral growth signal” means unusually fast recent rating gains; it is an indicator, not download data.
Price tracking
Price intelligence
First snapshot captured. The trend line starts after the next crawler price observation.
- First observed Oct 13, 2026 · 1:42 AM Free
Screenshots