About this app
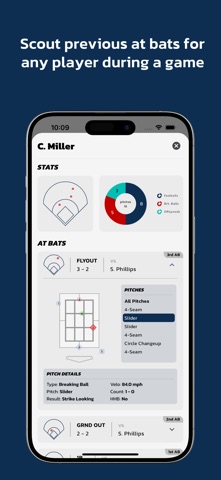
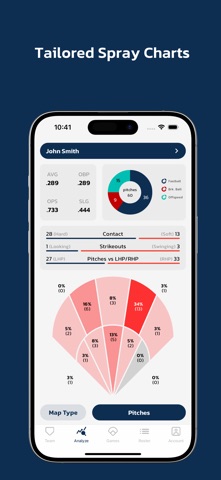
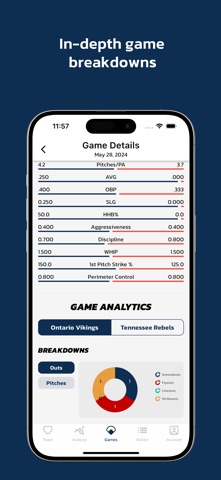
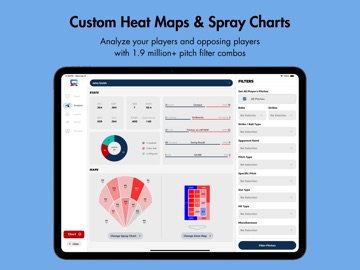
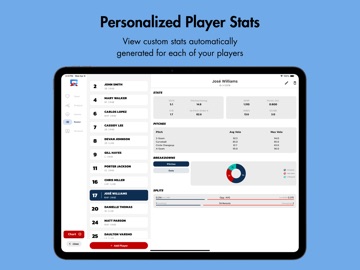
Chart your team like never before with Charts Analytics Pitch-by-Pitch Charting, Custom Heat/Pitch Maps, Spray Charts and Analytics. Chart your team then create tailored Heat/Pitch Maps or Spray Charts for any scenario with over 1.9 million combinations of pitch filters available. You want to see all of a pitcher's 2-strike pitches to left handed hitters? No problem. How about all of the pitches a batter hits for extra bases? Easy. With Charts Analytics, all you have to do is track the pitches and the app will do the rest. Plus, each of your players can create a FREE account so they can analyze their stats any time they want. Ditch your pitcher and hitter charting sheets and experience pro level analytics with our Baseball and Softball Charting App. Full app features include: - Pitch-by-Pitch Charting - Heat/Pitch Maps - Spray Charts - Team Stats/Trends - Player Specific Stats - Game Breakdowns - Export games to a spreadsheet - and more... Know that you're getting the analytics you want because Charts Analytics is made by players, for players.
Latest release
What’s New
- NEW FEATURE — You can now select the positions of baserunners after each AB to enable metrics for RISP (find RISP stats in the Team page and a player’s stats page after clicking their name in the Roster page) - NEW FEATURE — Filter pitches in the Analyze page by each game or against specific teams - BUG FIX — Some at bats would not save after resuming a game from Offline Mode - BUG FIX — Some player’s stats would show up as zero in the Player Stats section of the team page - An improved Chart Setup flow to make it easier to see what settings are applied - Other bug fixes and improvements
Audience growth
Ratings growth
Baseline captured. Growth appears after the crawler observes a changed rating count.
Momentum comes from crawler snapshots for the tracked storefront. “Viral growth signal” means unusually fast recent rating gains; it is an indicator, not download data.
Price tracking
Price intelligence
First snapshot captured. The trend line starts after the next crawler price observation.
- First observed Aug 19, 2026 · 7:42 PM Free
Screenshots