About this app
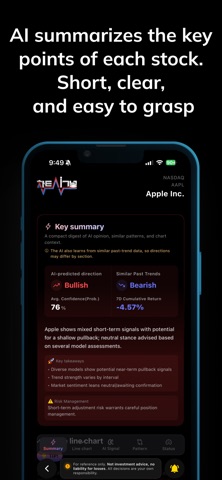
ChartSignal is an investment companion app that uses proprietary research indicators to deliver analysis results from multiple LLMs using the same prompt. It also processes these results into Index scores, helping you quickly understand overall market trends and each asset’s bullish or bearish direction across stocks and crypto. -- Key Features -- - Combined analysis from multiple AI models Multiple AI models analyze charts side by side View each model’s outlook and confidence at a glance 5-level rating: Strong Bullish / Bullish / Neutral / Bearish / Strong Bearish A unified summary as an AI Opinion Index for clearer interpretation More AI models will be added continuously - Core indicators at a glance Quickly assess market conditions with Indexes built from our proprietary analysis data Market Analysis / AI Opinion Index / Volume Index / Trend Index / Volatility Index Understand market sentiment with Fear / Neutral / Greed zones Easy-to-read charts and gauges for intuitive insights - Signal push notifications (Subscription only) Get alerts when a watchlist asset’s direction changes Analysis starts after each market’s daily close Receive a push notification when results are ready - Simple search Search by ticker or asset name See key information right from the search results - Supported markets Bithumb, Upbit (KRW markets) OKX Futures, Binance Futures - Coming soon U.S. stocks, Korean stocks, and more Additional markets may be added over time - Disclaimer This app is for informational purposes only and does not constitute investment advice. All investment decisions are made at the user’s own discretion and responsibility.
Latest release
What’s New
- Implemented watchlist feature - Other performance improvements
Audience growth
Ratings growth
Baseline captured. Growth appears after the crawler observes a changed rating count.
Momentum comes from crawler snapshots for the tracked storefront. “Viral growth signal” means unusually fast recent rating gains; it is an indicator, not download data.
Price tracking
Price intelligence
First snapshot captured. The trend line starts after the next crawler price observation.
- First observed Aug 25, 2026 · 6:58 PM Free
Screenshots