About this app
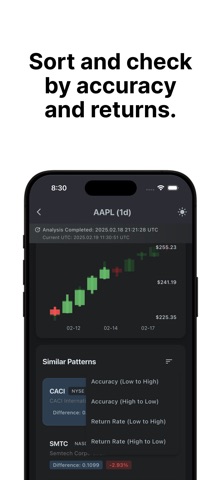
This app analyzes candlestick charts of various NASDAQ stocks and uses AI to identify past patterns similar to the current chart. Users can select a stock, and the AI will find similar historical patterns, allowing for a visual comparison of how they evolved. This helps users gain insights into market trends and refine their investment strategies.
Latest release
What’s New
Bug Fix
Audience growth
Ratings growth
Baseline captured. Growth appears after the crawler observes a changed rating count.
Momentum comes from crawler snapshots for the tracked storefront. “Viral growth signal” means unusually fast recent rating gains; it is an indicator, not download data.
Price tracking
Price intelligence
First snapshot captured. The trend line starts after the next crawler price observation.
- First observed Aug 11, 2026 · 7:32 PM Free
Screenshots