About this app
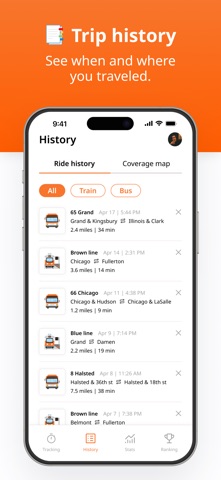
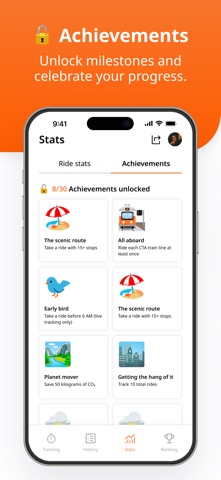
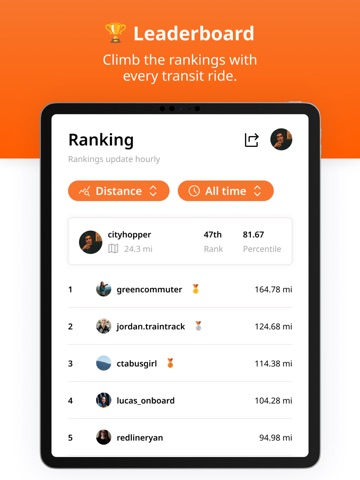
Turn your CTA rides into meaningful, personal data. Track distance, spending, CO₂ impact, and more. Compete with Chicago riders on city-wide leaderboards and climb the ranks. KEY FEATURES: - Automatic GPS tracking of every CTA ride in real-time - Personal in-depth stats and analytics - Chicago-wide leaderboards to compete with other riders - Achievement system with transit milestones to unlock - Complete ride history and coverage map See how your daily commutes add up. Track your total distance, ride time, number of trips, CO₂ emissions saved, transit spending, and even your most used line. Compare trends over time with weekly, monthly, and yearly views — all personalized to your transit habits. Join Chicago's growing community of transit riders who track their public transit usage. Whether you're taking the Red Line downtown or catching the bus to work, every ride counts toward your personal transit impact. Available for free. Battery efficient. Built for Chicago CTA buses and trains. Download Transit Stats today and start turning your commute into meaningful progress. Data safety and security: Transit Stats collects only the essentials needed to show you real-time transit information. We don't collect or sell personal information to third parties, and we never track sensitive data or financial information. Your account data is protected with industry-standard security measures and is automatically deleted when you close your account.
Latest release
What’s New
Transit Stats v1.1 NEW: Environmental Impact - See your CO2 savings as real-world equivalents like LED hours and smartphones charged NEW: Dark Mode - Easy on the eyes for night riders Faster Performance - Ride history and leaderboards load instantly Manual Rides Update - Now pick any date/time for past trips
Audience growth
Ratings growth
Baseline captured. Growth appears after the crawler observes a changed rating count.
Momentum comes from crawler snapshots for the tracked storefront. “Viral growth signal” means unusually fast recent rating gains; it is an indicator, not download data.
Price tracking
Price intelligence
First snapshot captured. The trend line starts after the next crawler price observation.
- First observed Aug 19, 2026 · 5:14 AM Free
Screenshots