About this app
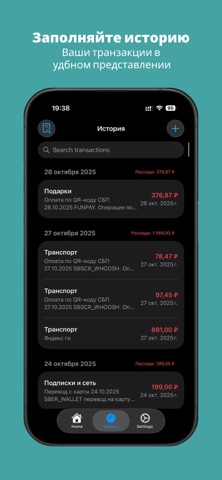
Where does your money go? Money Charts gives you answers in the format you need. Build your financial dashboard like a constructor Choose and combine analytics blocks: expense line charts, category pie charts, period comparison bar charts, trend tables. Move, add, remove — create your dashboard in minutes. Control visibility and order of cards through favorites editing. Automatic statement import Upload a Sberbank statement as PDF or paste text from any bank. Transactions are recognized automatically. Categories are assigned automatically based on operation types. Dashboard updates instantly. We're working on improving recognition for other banks — stay tuned for updates! Smart analytics Average spending, largest expenses, expense forecasts, trends. Compare any periods and see dynamics. Each widget shows data that matters to you: expenses by category, income, capital, daily expenses, weekly averages, forecasts, and more. Everything stays with you Data is stored locally on your iPhone using Core Data. No bank connections, no third-party data sharing. Works offline. Your finances. Your dashboard. Your control. Download free and build your first dashboard right now.
Latest release
What’s New
- Updated UI - Other stuff - Bug fix
Audience growth
Ratings growth
Baseline captured. Growth appears after the crawler observes a changed rating count.
Momentum comes from crawler snapshots for the tracked storefront. “Viral growth signal” means unusually fast recent rating gains; it is an indicator, not download data.
Price tracking
Price intelligence
First snapshot captured. The trend line starts after the next crawler price observation.
- First observed Aug 19, 2026 · 11:47 PM Free
Screenshots