About this app
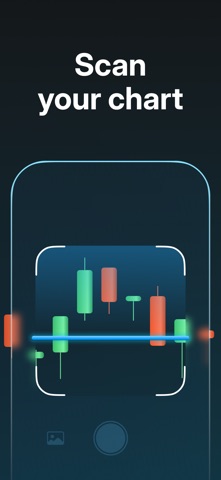
Turn trading charts into insights with Chart AI Analyzer by FinGPT, your all-in-one trading assistant and finance learning app. Chart AI Analyzer by FinGPT is your intelligent assistant for trading and financial education. Whether you’re just getting started with the stock market or you’re an advanced trader, Chart AI Analyzer by FinGPT helps you analyze charts and market trends. TURN CHARTS INTO INSIGHTS: • Instantly scan stock market and forex charts with AI: supports stocks, ETFs, indices, commodities, gold, and digital assets. • Explore leading tickers: Apple, Tesla, Nvidia, Amazon, Microsoft, Alphabet, and more. • Read AI-generated summaries of assets listed on major exchanges: New York Stock Exchange (NYSE), NASDAQ, London Stock Exchange (LSE), Euronext, and more. • Track benchmarks including the Dow Jones, S&P 500, FTSE 100, and more. • For digital assets, receive AI-powered summaries of data from platforms like Binance and Coinbase, covering Bitcoin (BTC), Ethereum (ETH), Dogecoin (DOGE), and more. • Analyze forex trading signals, futures trading data, and market-watch movements across global platforms. • Compatible with tools you already use, including MetaTrader 4, MetaTrader 5, TradingView, and more. FOR BEGINNERS & PROS: • New investors can use Chart AI Analyzer by FinGPT to get simplified stock analysis, second opinions, and clear overviews of market behavior, profit potential, and risk insights. Support your journey with tools like copy trading, paper trading, and platforms such as the Investopedia stock simulator or other trading games. • Experienced traders can use Chart AI Analyzer by FinGPT to quickly review technical analysis with indicators like RSI, MACD, EMA, Fibonacci, candlestick patterns, and trend signals—clearly explained. Keep using your go-to tools like a stock screener, trading journal, trading apps, and your brokerage, while getting AI-powered insights that make your workflow faster and more focused. DISCLAIMER: This app is for educational and informational purposes only. It is not investment advice, financial planning, or an offer to buy or sell any security. Nothing in the app should be considered a recommendation to buy, hold, or sell financial products. While your experience may be personalized based on your usage history, the content is not tailored to your individual financial situation. All investments involve risk, including the potential loss of capital, and past performance does not guarantee future results. Always conduct your own research and consult licensed financial, legal, or tax professionals before making any investment decisions. We do not act as a broker, investment advisor, or financial planner. Terms of Use: https://viedy.com/charto-ai/terms Privacy Policy: https://viedy.com/charto-ai/privacy
Latest release
What’s New
Minor bugfixes and performance improvement to make your chart analysys experience better
Audience growth
Ratings growth
Baseline captured. Growth appears after the crawler observes a changed rating count.
Momentum comes from crawler snapshots for the tracked storefront. “Viral growth signal” means unusually fast recent rating gains; it is an indicator, not download data.
Price tracking
Price intelligence
First snapshot captured. The trend line starts after the next crawler price observation.
- First observed Aug 31, 2026 · 6:09 AM Free
Screenshots