About this app
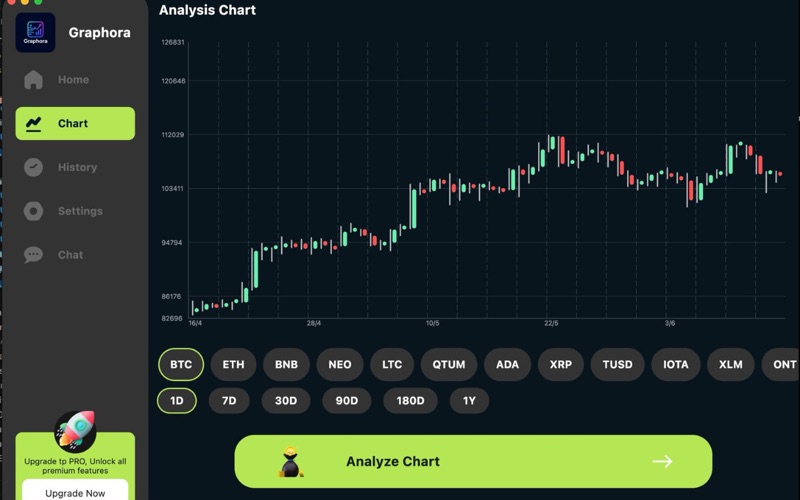
AI Chart Analysis for macOS is an intelligent desktop app designed to help users understand market movements quickly and clearly. Built specifically for macOS, it uses advanced AI to analyze charts and transform complex price data into easy-to-understand insights. The app automatically detects trends, patterns, support and resistance levels, and potential reversals across multiple timeframes. Instead of manual chart reading, users receive clear visual guidance and AI-driven summaries that explain what’s happening in the market. With a clean, responsive macOS interface, the app supports different analysis styles, from short-term trading to long-term investing. It is suitable for stocks, crypto, forex, and other financial instruments, helping reduce guesswork and emotional bias through data-driven analysis. AI Chart Analysis for macOS delivers faster insights, clearer charts, and smarter decision support in a smooth desktop-first experience. Note: Subscription prices may vary depending on your country, and charges will be converted to your local currency accordingly. AI Chart Analysis Subscription Details ------------------------------------------ Most Popular - Weekly Subscription Plan ------------------------------------------ Monthly Boost - Monthly Subscription Plan (Including 3 Days Trials) ------------------------------------------ Yearly Yield - Yearly Subscription Plan ------------------------------------------ Payments are processed via your iTunes account upon purchase confirmation. Subscriptions renew automatically unless turned off at least 24 hours before the current billing cycle ends. Renewal charges occur within 24 hours before the end of the subscription period, at the original price. You can manage or disable auto-renewal anytime through your Account Settings after purchase. Privacy Policy: https://sites.google.com/view/privacy-policyshoaib/home Term Of Use: https://sites.google.com/view/terms-conditionsshoaib/home
Latest release
What’s New
Introducing New Features Major Bug Fix
Audience growth
Ratings growth
Baseline captured. Growth appears after the crawler observes a changed rating count.
Momentum comes from crawler snapshots for the tracked storefront. “Viral growth signal” means unusually fast recent rating gains; it is an indicator, not download data.
Price tracking
Price intelligence
First snapshot captured. The trend line starts after the next crawler price observation.
- First observed Aug 7, 2026 · 5:28 PM Free
Screenshots