About this app
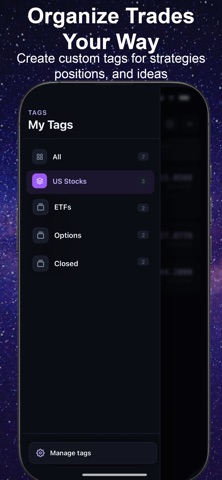
Kokoi Stock Average Cost Calculator is a simple and efficient tool designed for investors who want to better manage their positions. Whether you’re averaging down or planning your next trade, this app helps you quickly calculate your updated average cost and understand how each trade impacts your portfolio. New: Visual Insights • Track how your average cost changes after each trade • Visualize your cumulative profit over time • Understand the real impact of your trading decisions New: Tags & Grouping • Organize stocks with your own tags — group by market, strategy, or anything you like • A stock can belong to multiple tags at once • Switch between groups from a side drawer; create, rename, reorder, or delete tags anytime • Tags appear in the stock list and on the detail page, and you can add them when creating a stock Key Features • Calculate average cost after multiple buys • Support for different fee structures and real cost tracking • Simulate buy and sell strategies before execution • Clean and intuitive interface with instant results • No account required — your data stays on your device This app is designed as a utility tool only. It does not provide financial advice. Make smarter, more informed decisions with clarity and simplicity.
Latest release
What’s New
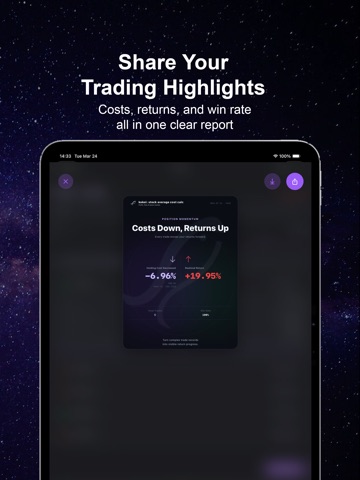
• Refined trade records, cost calculations, and trade simulations for more reliable input and results • Improved shareable reports, making every move more worth sharing • Enhanced localization so dates and text feel more natural in your region • Fixed a few small issues for smoother launches, navigation, and everyday use
Audience growth
Ratings growth
Baseline captured. Growth appears after the crawler observes a changed rating count.
Momentum comes from crawler snapshots for the tracked storefront. “Viral growth signal” means unusually fast recent rating gains; it is an indicator, not download data.
Price tracking
Price intelligence
First snapshot captured. The trend line starts after the next crawler price observation.
- First observed Sep 4, 2026 · 6:08 AM Free
Screenshots