About this app
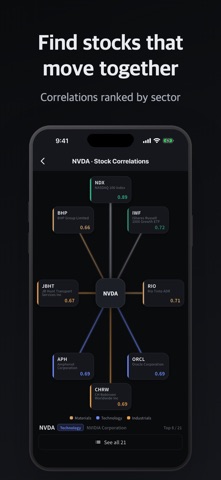
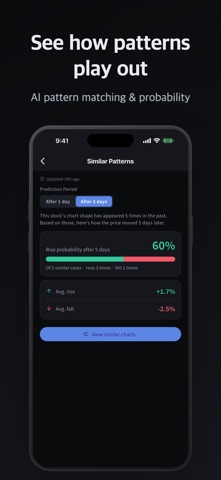
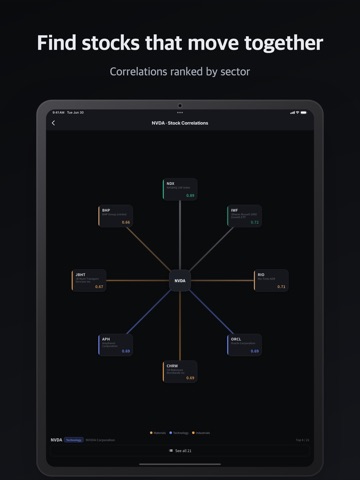
MarketPug turns scattered market data into clear, visual decisions. See how the whole market is moving, dig into any stock, and find what moves together - all in one fast app. Most apps give you a price and a chart. MarketPug gives you the picture behind the price: sector strength, market-cap leaders, institutional holdings, news sentiment, fundamentals, similar historical chart patterns, and an AI that explains it all in plain language. KEY FEATURES Sector heatmap See which sectors are hot and cold at a glance, across multiple periods. Tap a sector to drill into its constituents. Market-cap ranking and trend Browse the largest companies by exchange and watch total market-cap and volume trends over time. Correlation discovery Find the stocks that move together. Pick any symbol and see its strongest-correlated names as a focused relationship graph, then compare two price series side by side. Deep per-stock analysis - Interactive candlestick charts with indicators and drawing tools - Fundamentals: market cap, PE, EPS, margins, dividend yield, analyst ratings - Institutional holdings, plus the full portfolio behind each institution - News with sentiment over time - Similar chart patterns from history to see how comparable setups played out AI stock chat Ask questions about any symbol and get a clear, context-aware answer built from the same data the app shows you. Chart quiz Test your read of the market with a chart-prediction game and track your stats. Watchlist Follow the symbols you care about and see correlations and prices tuned to your list. USE IT TO - Scan the market in seconds with the sector heatmap - Research a stock end to end before you act - Discover related names you would have missed - Sharpen your chart-reading with the quiz Download MarketPug and see the market clearly. Terms of Use (EULA): https://www.apple.com/legal/internet-services/itunes/dev/stdeula/
Latest release
What’s New
Bug Fix
Audience growth
Ratings growth
Baseline captured. Growth appears after the crawler observes a changed rating count.
Momentum comes from crawler snapshots for the tracked storefront. “Viral growth signal” means unusually fast recent rating gains; it is an indicator, not download data.
Price tracking
Price intelligence
First snapshot captured. The trend line starts after the next crawler price observation.
- First observed Aug 11, 2026 · 7:32 PM Free
Screenshots