About this app
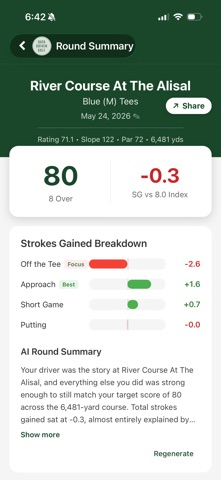
Data Driven Golf tells you exactly where your game gains and loses strokes, calibrated to YOUR handicap instead of a PGA Tour baseline. Most strokes gained tools compare every shot to tour pros. Interesting, but it doesn't tell a 12-handicap what to practice this week. Data Driven Golf calibrates expected strokes to your target handicap, so every number answers one question: did that shot help or hurt against the golfer you're trying to become? HOW IT WORKS - Log each shot in seconds with the hole-by-hole wizard. Lie and distance is all it takes. - See strokes gained on every shot in real time as you play. - Off the tee, approach, short game, putting: find out which part of your game actually costs you strokes. WHAT YOU GET - Round summaries with a full strokes gained breakdown, scorecard, and best/worst shot highlights - AI round recaps that read like a caddie's notes on your day - Trends across rounds: rolling averages, par 3/4/5 splits, performance by lie and by distance - Charts benchmarked against PGA, scratch, 10 and 20 handicap curves, so you can see exactly where you sit - A 25,000+ course catalog with tee-by-tee yardage, rating, and slope, plus manual course entry - Friends: share your rounds, stats, and charts with your regular group - Public share links for any round YOUR DATA IS YOURS Export every round to CSV anytime. No lock-in. Data Driven Golf is free and built in the open with a small community of golfers whose feedback shapes every release. Questions or ideas? drew@datadriven.golf gets read by an actual human named Drew.
Audience growth
Ratings growth
Baseline captured. Growth appears after the crawler observes a changed rating count.
Momentum comes from crawler snapshots for the tracked storefront. “Viral growth signal” means unusually fast recent rating gains; it is an indicator, not download data.
Price tracking
Price intelligence
First snapshot captured. The trend line starts after the next crawler price observation.
- First observed Aug 19, 2026 · 5:08 PM Free
Screenshots