About this app
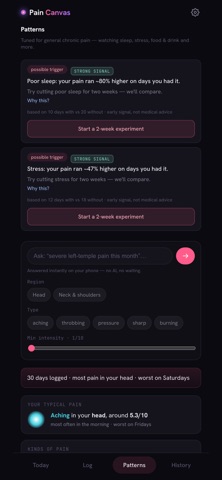
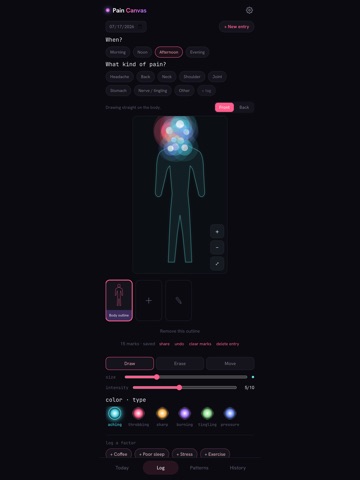
Most trackers make you turn pain into a number. Pain Canvas lets you paint it. Draw exactly where it hurts — the shape, the spread, the intensity — on a body map or your own photo. Pick what it feels like: aching, throbbing, sharp, burning, tingling, pressure. Each type gets its own color, so your history becomes something you can actually see. YOUR DAY, AT A GLANCE • Log attacks in seconds, tagged morning / noon / afternoon / evening • Track the things around your pain: sleep, stress, caffeine, meals, meds, weather • Streaks and a weekly review keep the habit alive PATTERNS IN PLAIN LANGUAGE • Pain Canvas correlates your logs and tells you what it found — "Poor sleep: your pain ran ~80% higher on days you had it" • Honest statistics: it only speaks up when the signal is real, and it's clear that it's an early signal, not medical advice • Ask questions about your own history — answered instantly on your phone, no AI, no waiting • Start a two-week experiment on any suspected trigger and let the data decide BUILT FOR YOUR DOCTOR'S APPOINTMENT • Generate a clean, printable summary of your history — where, how often, how bad, and what correlates • Walk in with a picture instead of a memory PRIVATE BY DESIGN • Your data belongs to you, synced securely to your account so a lost phone never means lost history • Photos are stored privately, visible only to you • Delete your account and every trace of your data any time, right from Settings Pain Canvas is a self-tracking journal, not a medical device. It doesn't diagnose or treat anything — it helps you see your own story clearly and share it with the people who can.
Latest release
What’s New
Your pain journal just became an investigation. • NEW: Case-opening onboarding — tell us your theories ("what makes it worse?") and Pain Canvas starts testing them against your real logs. • NEW: Your Theories board — see where the evidence stands on each suspect: testing, agreeing, or helping. • NEW: The Timeline — scroll your last 90 days of life (meds started, notes, cycle) laid against your pain. • NEW: Your monthly letter — a short, personal recap of how this month compared to last, and what to watch next. • NEW: Share "My Pain Story" — a summary image of your month to send to family or bring to your doctor. • Today's Risk on your home screen when your known suspects are active. • Drawing and scrolling no longer fight each other. Press and drag to mark; swipe to scroll. • Body outlines are now front or back — choose a side before you draw, and add a second outline for the other side. • Fixed: tapping an entry in History or Today didn't open it. • Entries now need a photo or the body outline before they can be saved. • History: filter by last 7, 30 or 90 days, or jump straight to a date. • Today: your streak now sits above the list, which shows five entries with "Load more". • Weather is back on Today, with the day's conditions and pressure trend. • Icons redrawn throughout so they display correctly on every device. • The printed report and setup screens no longer sit under the status bar. • Clearer evidence language throughout, plus many small fixes. As always: private to you, synced to your account, and never medical advice — just your own story, made visible.
Audience growth
Ratings growth
Baseline captured. Growth appears after the crawler observes a changed rating count.
Momentum comes from crawler snapshots for the tracked storefront. “Viral growth signal” means unusually fast recent rating gains; it is an indicator, not download data.
Price tracking
Price intelligence
First snapshot captured. The trend line starts after the next crawler price observation.
- First observed Aug 16, 2026 · 12:21 AM Free
Screenshots