About this app
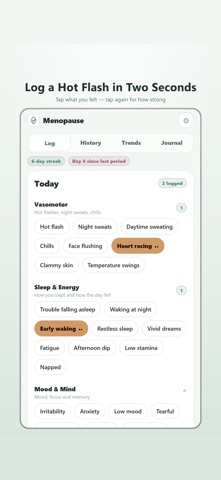
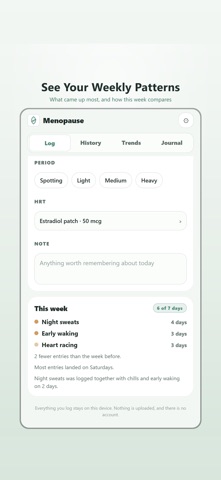
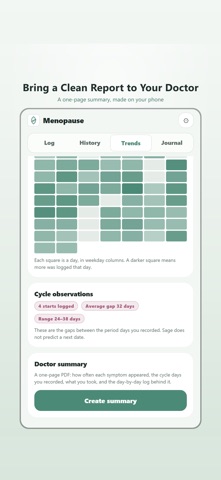
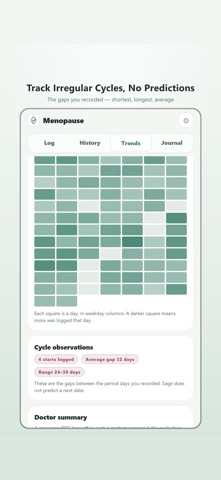
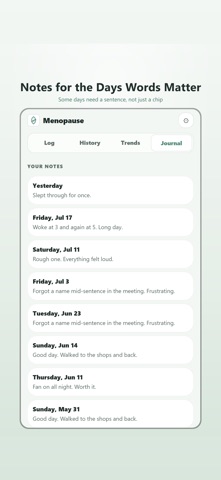
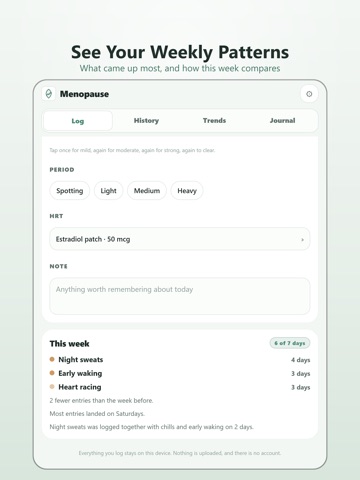
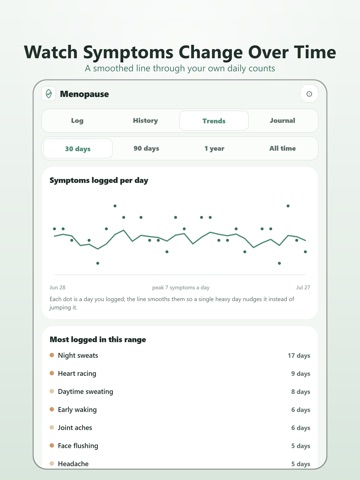
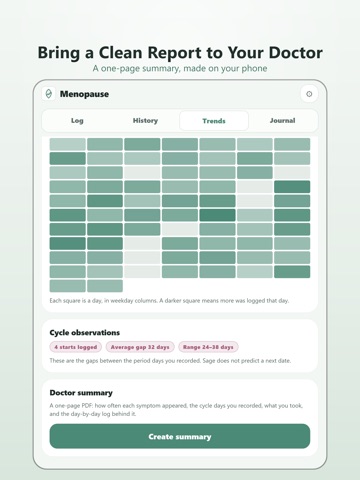
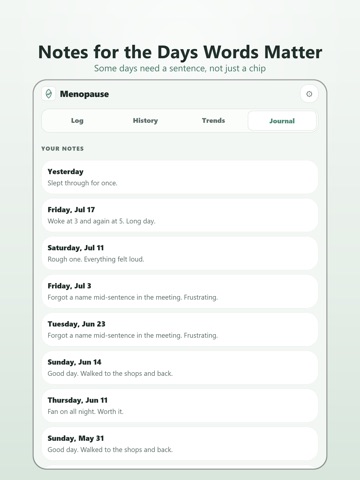
A menopause tracker built around the days themselves: tap what you felt, and let the pattern show up on its own. Sage is a private menopause tracker and symptom diary. Open it, tap the symptoms that match your day — hot flashes, night sweats, broken sleep, mood, brain fog, aches — then tap again to say whether each one was mild, moderate or strong. That is the whole loop, and it takes about two seconds. No forms, no questionnaires, no account. WHAT YOU CAN LOG • 41 plain symptom descriptions across four sets: Vasomotor, Sleep & Energy, Mood & Mind, and Body • A hot flash log where every entry carries a mild, moderate or strong rating — not just a tick • Night sweats, chills, flushing, heart racing and daytime sweating, together in the vasomotor set • Sleep and energy: trouble falling asleep, waking at night, early waking, restless nights, fatigue • Mood and mind: irritability, anxiety, low mood, mood swings, brain fog, forgetfulness, focus • Body: joint and muscle aches, headache, migraine, bloating, dry skin, hair thinning, dryness • Period days with a flow marker — spotting, light, medium or heavy • A free-text note on any day, because some days need a sentence • An HRT line for what you took, in your own words and your own doses HOW THE TWO-SECOND LOG WORKS Tapping a symptom once records it as mild; tap again for moderate, again for strong, and once more to clear it. One control, four states, no picker to open and nothing to confirm. A gentle streak counts the days you showed up, and one optional evening reminder — never more than one a day — will nudge you if you want it. Miss a day and nothing scolds you, and the reminder never names a symptom, because a lock screen is read by whoever is holding the phone. WHAT SAGE SHOWS YOU • A weekly card: your most-logged symptoms, how this week compares with the one before, and which weekday carried the most • A symptom diary you can scroll back through, day by day, exactly as you recorded it • Charts of how many symptoms you logged each day, with a smoothed line drawn through the noise • A calendar view of the last thirteen weeks, laid out in weekday columns • Cycle observations: the gaps between the period days you recorded — shortest, longest and average • A one-page PDF summary for an appointment: how often each symptom appeared, the cycle days, what you took, and the day-by-day log behind it NO PREDICTIONS, NO ADVICE Cycles are commonly irregular through perimenopause, so Sage never predicts a next date. It reports the gaps you actually recorded and stops there. It gives no medical, hormonal or lifestyle guidance, suggests no treatment and no supplement, and never tells you what stage you are in. It counts what you logged and shows it back to you. That is deliberate, and it is the whole design. PRIVATE, OFFLINE, AD-FREE, NO ACCOUNT There is no sign-up, no login, no cloud and no server. Your symptom diary stays on your phone, because this menopause tracker has nowhere else to send it. It works on a plane, in a waiting room, and with the wifi switched off. There are no ads anywhere in the app. The PDF summary is created on your phone and leaves it only if you choose to send it. WHO IT IS FOR Anyone in perimenopause or menopause who wants a hot flash log and symptom diary without a community feed, a sign-up wall, or an account: people working out whether this month is different from the last one, people getting ready for a conversation with a clinician, and people who simply want their own record of what these years actually felt like. Sage is a private journal, not a medical device. It provides no medical advice, diagnosis, or treatment. Consult your clinician about symptoms and treatment decisions. App interface is in English. Terms of Use (EULA): https://www.apple.com/legal/internet-services/itunes/dev/stdeula/ — Privacy Policy: https://kanac.github.io/syanac-legal/
Latest release
What’s New
Polish and performance improvements.
Audience growth
Ratings growth
Baseline captured. Growth appears after the crawler observes a changed rating count.
Momentum comes from crawler snapshots for the tracked storefront. “Viral growth signal” means unusually fast recent rating gains; it is an indicator, not download data.
Price tracking
Price intelligence
First snapshot captured. The trend line starts after the next crawler price observation.
- First observed Aug 22, 2026 · 1:31 PM Free
Screenshots