About this app
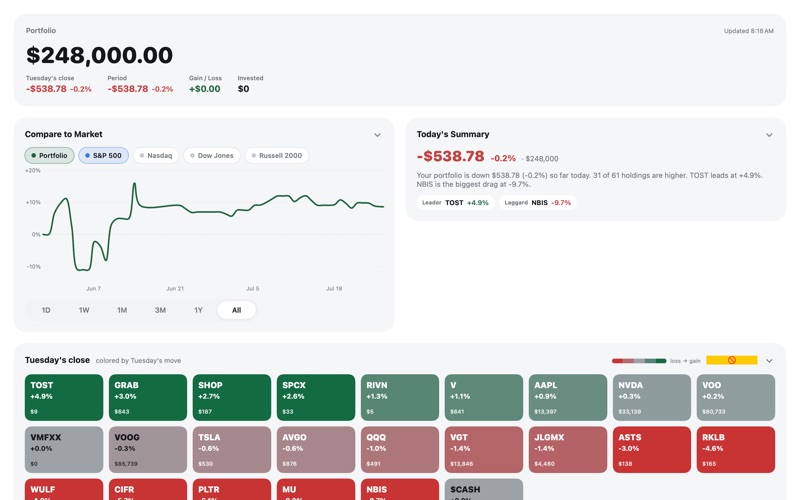
Aero puts your whole portfolio on one Mac screen. Every account, every position, and what the market did to them today — no tabs to dig through, no switching between brokerage websites. Open the window and the picture is there. ONE VIEW, EVERY ACCOUNT Hold the same stock in a rollover IRA, a Roth, and a taxable brokerage and Aero shows you the whole position at once — then breaks it down per account when you want the detail. Cash is counted too, so the total is the real total. SEE THE DAY AT A GLANCE A heatmap colours every holding by the day's move, so the winners and the drags are obvious before you read a single number. A plain-language recap tells you where the portfolio stands and which position led or lagged. MEASURE AGAINST THE MARKET Compare your portfolio's performance against the S&P 500, Nasdaq, Dow Jones, and Russell 2000 on one chart. Choose a single day, a week, a month, a quarter, a year, or the whole history — and hover anywhere on the curve to read the exact figure. IMPORT WHAT YOU ALREADY HAVE Drag in CSV exports from your brokerage, or screenshots of your holdings, and Aero reads them. Up to 100 files at once. If you already have accounts, it compares what's incoming against what's there and shows you exactly what would change — line by line — before anything is written. Nothing is committed until you accept it, and you can cancel the whole thing at any point. BUILT FOR THE MAC A native Mac app, not a web page in a window. Sign in with Apple — no password to create, no email to hand over. Aero shares an account with Moment, so your portfolio follows you between your Mac and your iPhone.
Latest release
What’s New
• The past-30-days and past-year figures now measure from the same day the chart does, so the two can no longer disagree about the same period. • A new installation always starts signed out. Previously, installing onto a Mac that had run Aero before could restore the earlier session. • Signing out now clears every local copy of your holdings. • Reliability improvements and minor fixes.
Audience growth
Ratings growth
Baseline captured. Growth appears after the crawler observes a changed rating count.
Momentum comes from crawler snapshots for the tracked storefront. “Viral growth signal” means unusually fast recent rating gains; it is an indicator, not download data.
Price tracking
Price intelligence
First snapshot captured. The trend line starts after the next crawler price observation.
- First observed Aug 15, 2026 · 2:06 PM Free
Screenshots