About this app
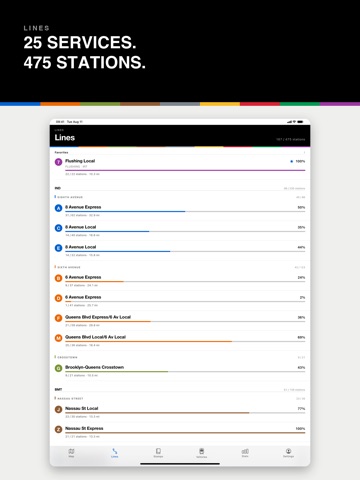
Every station you ride fills in. NYC Subway Log is a station-logging app for the New York City Subway — all 25 services and 475 stations, from the 1 to the Rockaway Park Shuttle. Tap a station to log it, and the map fills in with the trunk colors you already know. ◆ Built for · Riders working through the Subway Challenge · Anyone curious how much of the system they have actually seen · New arrivals learning the network one line at a time ◆ What you get · Every station on every service, in MTA's own line colors · A stamp book that fills in as you go · A "line complete" card when you finish a service end to end · Five-borough progress heatmap · Photos and notes on any station visit · Two maps — a real one, and a network view with everything but the subway stripped away · A rolling stock book, from the R32 Brightliner to the R211 · iCloud sync, free for everyone · Backup (JSON) and export (CSV) ◆ Past rides count Log a station you rode ten years ago and pick the date. Segment entry logs a whole stretch at once. ◆ Pro (monthly / yearly / lifetime) · Unlimited favorite lines · Detailed statistics and the five-borough heatmap · Watermark-free share cards · Export your stamps as an A4 PDF stamp book Browsing lines, logging stations, the stamp book, and iCloud sync are all free. Monthly and yearly plans auto-renew through your Apple ID unless cancelled at least 24 hours before the current period ends. Lifetime is a one-time purchase. NYC Subway Log is an independent app and is not affiliated with, endorsed by, or sponsored by the Metropolitan Transportation Authority. Station and route data comes from MTA's public GTFS feed. Terms of Use: https://www.kkirukstudio.com/legal/terms/ Privacy Policy: https://www.kkirukstudio.com/legal/privacy/
Latest release
What’s New
- Added a search box to the line list. Type a letter, a number, or a name like “8 Av Express”. - Search a station name and every line serving it appears under “Via station”. - Small fixes and improvements.
Audience growth
Ratings growth
Baseline captured. Growth appears after the crawler observes a changed rating count.
Momentum comes from crawler snapshots for the tracked storefront. “Viral growth signal” means unusually fast recent rating gains; it is an indicator, not download data.
Price tracking
Price intelligence
First snapshot captured. The trend line starts after the next crawler price observation.
- First observed Sep 14, 2026 · 5:24 PM Free
Screenshots