About this app
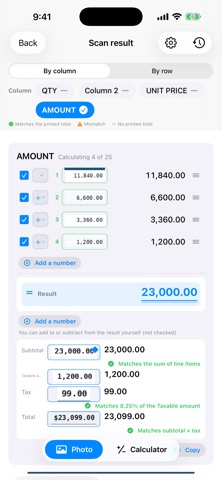
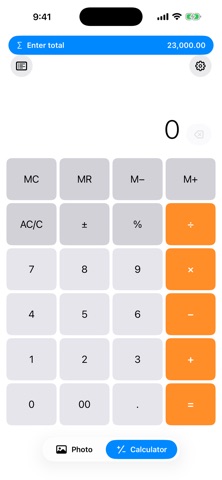
• Photograph a page and the figures it reads are calculated for you (photos from your library work too) • Every figure it reads is underlined on the photo. The color of the underline shows at a glance which figures were counted, which were left out (dates, addresses, document numbers), and which are worth a second look. • On a table, it recognizes the columns — unit price × qty = amount and the like — and warns you when what it calculates doesn't match what's printed. • If it read the wrong part of the page, you can point out the area you want read. • When something couldn't be read at all, you can add the figure yourself while looking at the photo. • A plain calculator is built in, so this one app covers it when you just want to work something out on the spot. • To work a scanned total against another number, a calculator opens across the bottom half of the screen, so you can keep calculating with the photo still in view.
Latest release
What’s New
Maintenance update. No changes to features.
Audience growth
Ratings growth
Baseline captured. Growth appears after the crawler observes a changed rating count.
Momentum comes from crawler snapshots for the tracked storefront. “Viral growth signal” means unusually fast recent rating gains; it is an indicator, not download data.
Price tracking
Price intelligence
First snapshot captured. The trend line starts after the next crawler price observation.
- First observed Sep 15, 2026 · 3:00 AM Free
Screenshots