About this app
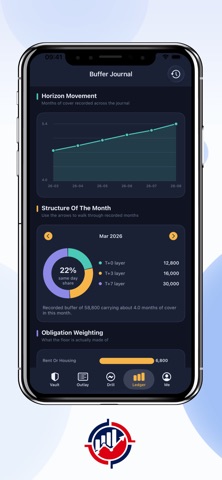
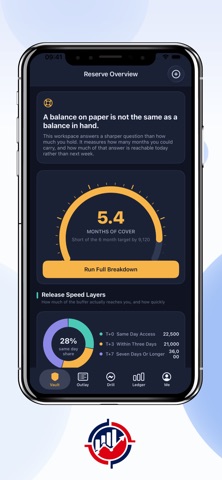
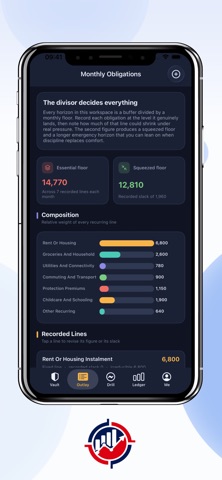
Most asset management tools stop at balance analysis. This workspace treats cash reserves as a liquidity plan: how many months of fixed and discretionary spending can the funds cover, and how much is immediately available on the day a cash need arises and a few days later. Each reserve is categorized by settlement speed: same-day cash, three-day liquid assets, or holdings settled in seven days or more. Monthly recurring expenses are entered as the budget baseline, and a retractable share of each reserve is marked to simulate normal spending and tight spending. Three financial periods are displayed side-by-side, with each settlement window corresponding to a period, so total non-liquidity balance sheet figures don't masquerade as immediate purchasing power. Choose a three-month, six-month, or twelve-month operating expense coverage standard. A comprehensive financial score on a 100-point scale considers coverage depth, the current-day liquidity share, and the gap to that standard, then highlights the weakest link among the three pillars.
Audience growth
Ratings growth
Baseline captured. Growth appears after the crawler observes a changed rating count.
Momentum comes from crawler snapshots for the tracked storefront. “Viral growth signal” means unusually fast recent rating gains; it is an indicator, not download data.
Price tracking
Price intelligence
First snapshot captured. The trend line starts after the next crawler price observation.
- First observed Sep 4, 2026 · 7:10 AM Free
Screenshots