About this app
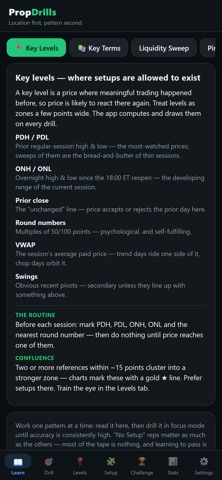
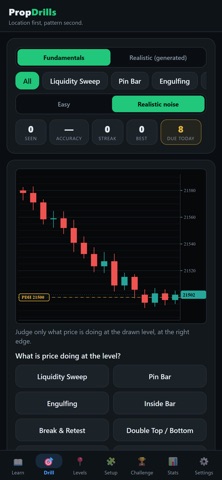
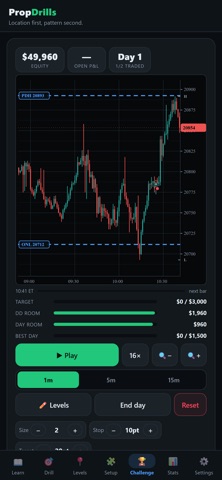
Train the one skill that matters on MNQ: reading price action around the levels that matter — then prove it in a simulated, prop-style evaluation. PropDrills is a practice tool, not a broker. No real money, no live market data, no account sign-up — everything runs on realistic generated MNQ-style charts and stays on your phone. LEARN THE LANGUAGE - Short lessons on the levels professionals watch: prior day high/low, overnight range, prior close, VWAP, round numbers - Why location comes first and candlestick patterns second DRILL THE EYE - Rapid-fire pattern recognition on realistic charts: liquidity sweeps, pin bars, engulfing, break & retest, double tops, VWAP bounces, FVG retests — and the underrated "no setup" - Instant feedback plus spaced repetition that re-serves what you miss - Accuracy, streaks, and per-pattern stats keep you honest MARK THE CHART YOURSELF - Level-marking drills: place PDH, PDL, ONH and ONL on a naked chart and get scored - Smooth, pinch-zoomable charts with 1m/5m/15m timeframes PROVE IT IN CHALLENGE MODE - A multi-day simulated evaluation with prop-style rules: profit target, trailing max drawdown, daily loss limit, consistency cap - Full trading sessions replayed bar by bar (1×–32×), with a pre-market analysis stage: study days of prior tape and mark your key levels - Name your levels (PDH, ONL, …) and they stay on the chart for the whole evaluation - Badges, pass streaks, and attempt history FREE VS PRO The core drills are free. Pro unlocks unlimited Challenge evaluations, every account size and scenario, and full history. IMPORTANT PropDrills is for education and training only. All trading is simulated; no real money is at stake and no brokerage connectivity exists. Simulated results do not predict or guarantee real trading results. Trading futures involves substantial risk of loss. PropDrills is not affiliated with any proprietary trading firm. Terms of Use: https://propdrills.com/terms Privacy Policy: https://propdrills.com/privacy
Audience growth
Ratings growth
Baseline captured. Growth appears after the crawler observes a changed rating count.
Momentum comes from crawler snapshots for the tracked storefront. “Viral growth signal” means unusually fast recent rating gains; it is an indicator, not download data.
Price tracking
Price intelligence
First snapshot captured. The trend line starts after the next crawler price observation.
- First observed Sep 4, 2026 · 7:10 AM Free
Screenshots