About this app
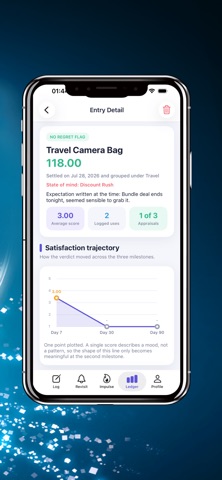
We offer you an excellent asset management tool that performs three evaluations after each asset decision: 7 days, 30 days, and 90 days. It also provides statistical analysis based on the amount spent, ultimately resulting in a clear financial assessment. It records each strategy transaction, including the settlement amount, accounting group, spending motivation, and expected return. The system automatically generates three post-settlement reviews. Each review displays your initial expectations next to the amount and asks you to give a value rating of 1 to 5, along with a brief strategy description. These three asset results are analyzed and statistically analyzed separately to form a value trajectory, ranking which decision frameworks resulted in the highest rate of return and the lowest average satisfaction return. Usage statistics are displayed next to each analysis result icon, providing you with clear reference results.
Audience growth
Ratings growth
Baseline captured. Growth appears after the crawler observes a changed rating count.
Momentum comes from crawler snapshots for the tracked storefront. “Viral growth signal” means unusually fast recent rating gains; it is an indicator, not download data.
Price tracking
Price intelligence
First snapshot captured. The trend line starts after the next crawler price observation.
- First observed Sep 1, 2026 · 1:54 PM Free
Screenshots