About this app
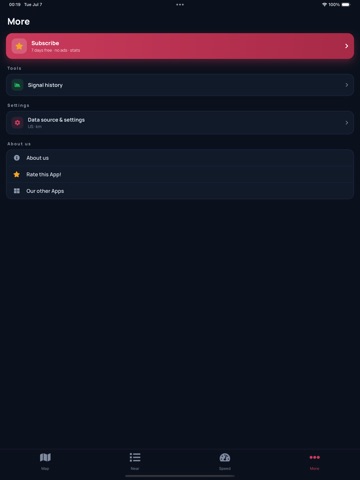
Cell Towers shows every cellular antenna and tower around you on a clear, interactive map. See exactly where your carrier's antennas are, understand why your signal is weak, and find the closest tower for better reception. WHY YOU'LL LOVE IT • Find the nearest cell towers and antennas to your location in seconds • Understand bad signal, dead zones and coverage gaps • See which operator owns each antenna and how far away it is • Tap any tower for details: operator, technology, MCC/MNC and address • Filter by carrier to focus on your own network • Auto-detects your country and the best data source from your location ACCURATE, OFFICIAL DATA For Chile (Subtel), Brazil (Anatel), Spain, France (ANFR), Germany (BNetzA), Ireland (ComReg), Canada (ISED), Denmark (Mastedatabasen), Colombia (ANE) and the United States (FCC) we use complete, official per-operator databases. Everywhere else in the world, antennas come from the OpenCellId community project. PERFECT FOR Troubleshooting mobile reception, comparing 4G/5G carrier coverage, choosing where to live or work, or simply being curious about the network around you. REMOVE ADS (OPTIONAL SUBSCRIPTION) Love the app? Subscribe to remove ads and support ongoing development. • "Remove ads" is a monthly auto-renewable subscription. • Payment is charged to your store account when you confirm the purchase. • The subscription renews automatically unless auto-renew is turned off at least 24 hours before the end of the current period. • Your account is charged for renewal within 24 hours before the end of the current period. • You can manage or cancel your subscription anytime from your account settings after purchase. Terms of Use: https://www.birdie.cl/terms-of-service/ Privacy Policy: https://www.birdie.cl/software/privacy/ Questions or feedback? Contact us — we'd love to hear from you.
Latest release
What’s New
• Denmark and Colombia now use official per-operator data: Mastedatabasen (DK) and ANE (CO). • The app is now available in Danish. • Stability improvements and fixes.
Audience growth
Ratings growth
Baseline captured. Growth appears after the crawler observes a changed rating count.
Momentum comes from crawler snapshots for the tracked storefront. “Viral growth signal” means unusually fast recent rating gains; it is an indicator, not download data.
Price tracking
Price intelligence
First snapshot captured. The trend line starts after the next crawler price observation.
- First observed Aug 24, 2026 · 1:39 AM Free
Screenshots