About this app
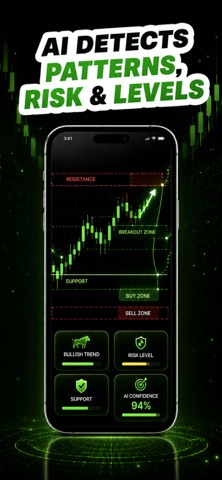
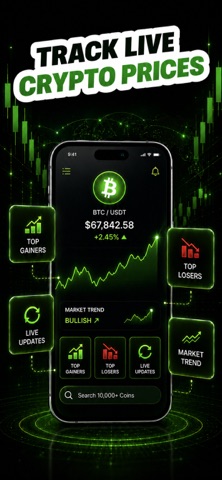
AI Chart Analysis helps you analyze trading charts, identify trends, and understand market movements using AI-powered tools. Key Features • AI Chart Analysis Upload chart images and receive AI-generated insights and observations. • Trend Detection Identify potential market trends and chart patterns. • Chart Scanner Analyze stock, forex, or crypto charts quickly and easily. • Market Insights Get simplified explanations of chart movements and structures. • Easy to Use Clean and simple interface designed for fast analysis. Why Choose AI Chart Analysis? Whether you're learning technical analysis or reviewing market charts, this app helps simplify chart reading and market understanding. Perfect For • Stock market traders • Crypto traders • Forex analysis • Technical chart learning Analyze Charts Smarter Download AI Chart Analysis and explore market trends with AI assistance. Note: Payment will be charged to your iTunes account at confirmation of purchase. Your subscription will automatically renew unless auto-renew is turned off at least 24-hours before the end of the current subscription period. Your account will be charged for renewal within 24-hours prior to the end of the current subscription period. Automatic renewals will cost the same price you were originally charged for the subscription. You can manage your subscriptions and turn off auto-renewal by going to your Account Settings on the App Store after purchase. Read our terms of service and Privacy Policy for more information. Privacy policy https://haleemapps.blogspot.com/2026/05/privacy-policy-ai-chart-analysis.html Terms of use https://haleemapps.blogspot.com/2025/08/terms-of-use.html
Latest release
What’s New
minor bug fixes
Audience growth
Ratings growth
Baseline captured. Growth appears after the crawler observes a changed rating count.
Momentum comes from crawler snapshots for the tracked storefront. “Viral growth signal” means unusually fast recent rating gains; it is an indicator, not download data.
Price tracking
Price intelligence
First snapshot captured. The trend line starts after the next crawler price observation.
- First observed Sep 7, 2026 · 11:03 AM Free
Screenshots