About this app
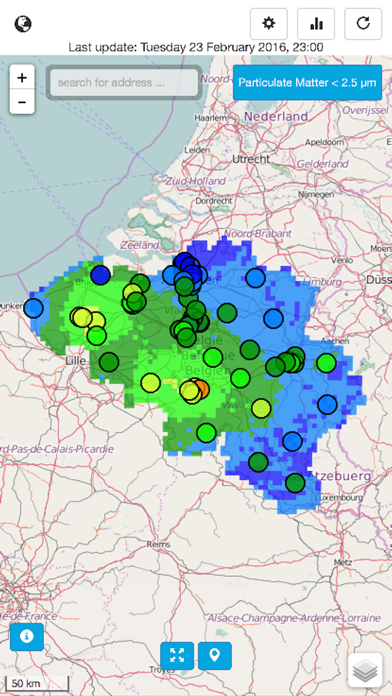
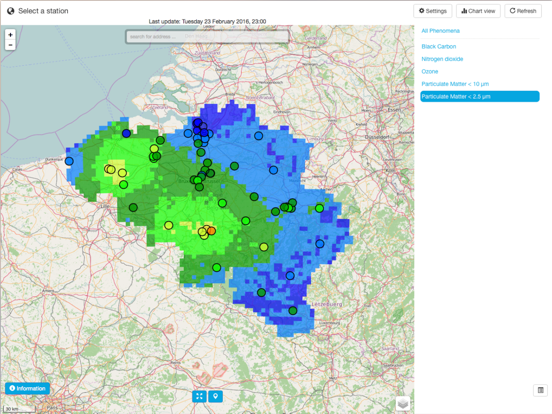
Consult air quality measured data and forecasts for Belgium. The app provides a map view displaying all stations measuring specific air pollutants in Belgium. In the map view interpolated maps (the RIO-model) are displayed when a specific pollutant is selected. Also forecast maps for today, tomorrow and today + 2 days can be selected. Specific stations can be selected and time series of measured concentrations can be displayed in a graph view. There also is a table view available of the same data.
Latest release
What’s New
This app has been updated by Apple to prepare for watchOS 27 compatibility. No new features are included. - fix unusable display on iPad (iOS 9.2.1)
Audience growth
Ratings growth
Baseline captured. Growth appears after the crawler observes a changed rating count.
Momentum comes from crawler snapshots for the tracked storefront. “Viral growth signal” means unusually fast recent rating gains; it is an indicator, not download data.
Price tracking
Price intelligence
First snapshot captured. The trend line starts after the next crawler price observation.
- First observed Sep 1, 2026 · 2:39 PM Free
Screenshots