About this app
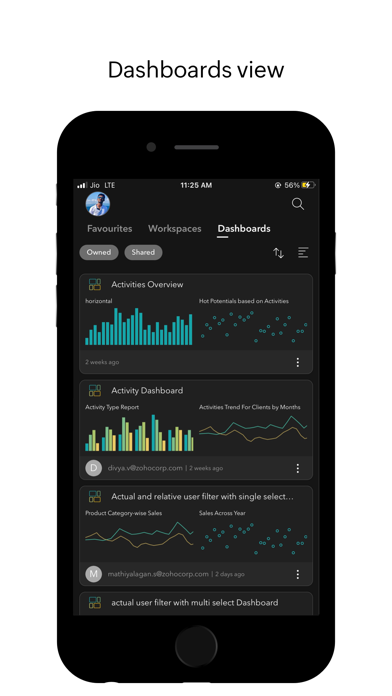
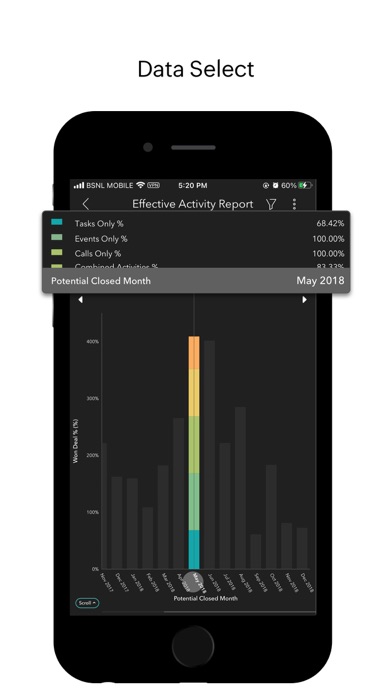
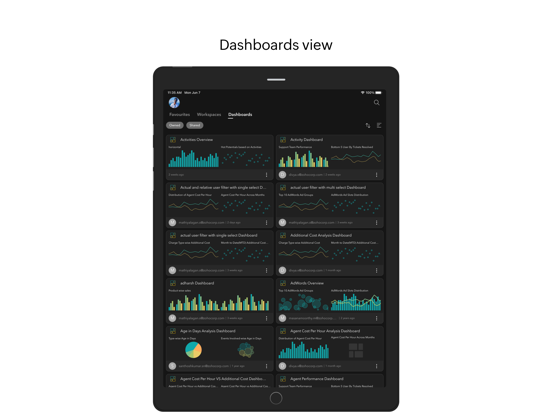
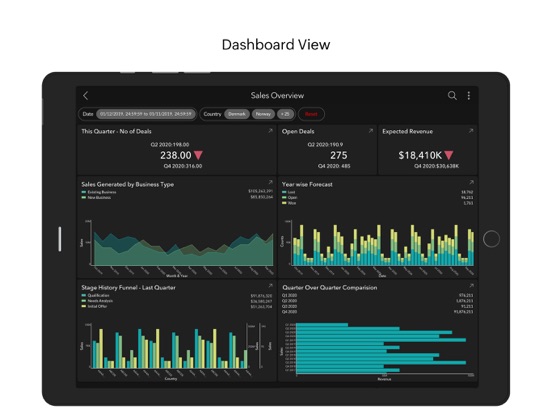
Immersive Dashboards App for Analytics Plus - Dashboards Analytics Plus - Dashboards is an immersive native mobile app to access & explore your business dashboards in Analytics Plus. Why is Analytics Plus - Dashboards app a must have analytical app? - An immersive native app An immersive purpose-built app just for accessing all your dashboards. Enjoy analytics like never before with intuitive gestures. - Make right data decisions - anytime, anywhere Easily access your Analytics Plus dashboards anytime and from anywhere. Stay well-equipped with your changing data trends and have your data, literally, on your finger tips. - Cool visualizations with myriad exploration options Supports a lot of interactive options that allow you to interact; interpret; and fork your data, and gain deeper insights. You can also change your chart types and drill-down your data from the comfort of anywhere with just a few taps. - Filter your way Dynamically filter your data to include/exclude any data value from your visualization. You can also dynamically filter the reports using the User Filters created in the dashboard/report. - Organize as you want Contextually equipped with options to sort, favorite, default, and delete workspaces, dashboards, and reports.
Latest release
What’s New
Introducing new features to enhance your app experience: Share From now on, you can easily share or publish your dashboards from your mobile on the go. Tap "Share" on the Dashboards page to explore the share and publish options. Commenting You can now start a discussion over a Dashboard right from the app. Zia Insights Zia Insights is now available for the reports in your dashboards. Zia gives you actionable insights in the form of digestible narrations. This enables you to get the insights immediately instead of manually interpreting them. - Bugs fixes & improvements
Audience growth
Ratings growth
Baseline captured. Growth appears after the crawler observes a changed rating count.
Momentum comes from crawler snapshots for the tracked storefront. “Viral growth signal” means unusually fast recent rating gains; it is an indicator, not download data.
Price tracking
Price intelligence
First snapshot captured. The trend line starts after the next crawler price observation.
- First observed Sep 20, 2026 · 4:31 AM Free
Screenshots