About this app
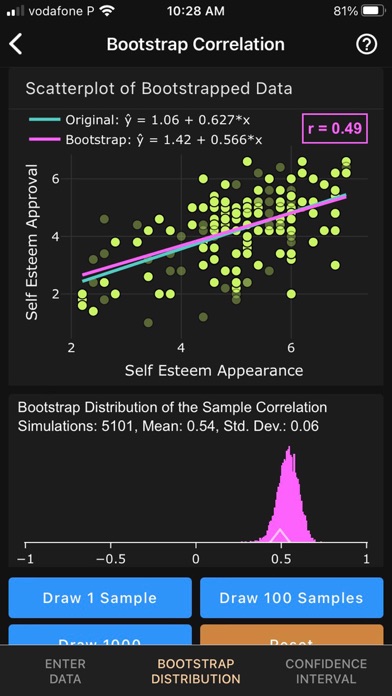
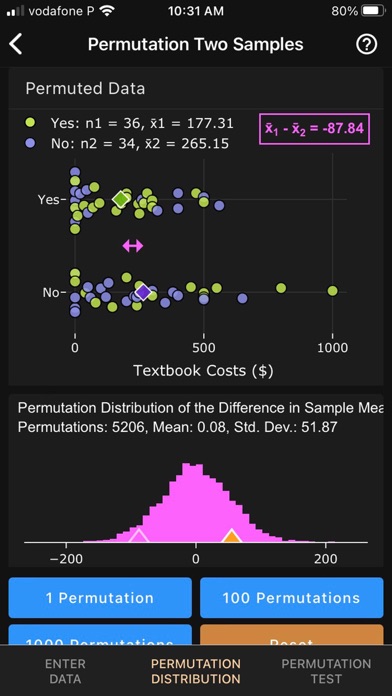
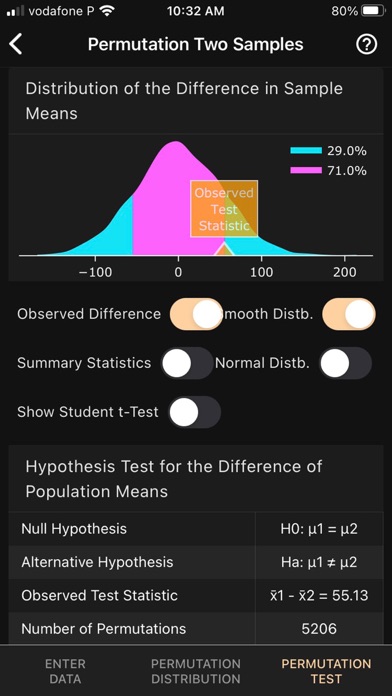
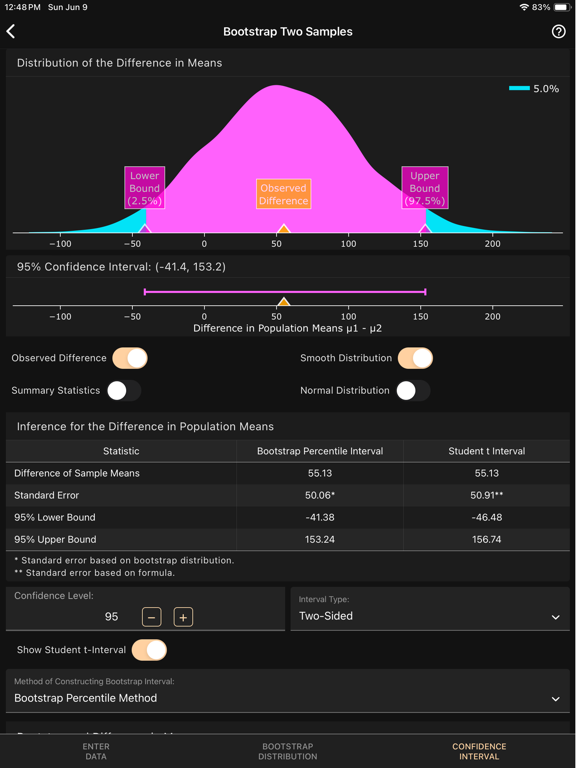
Bootstrap Confidence Intervals and Permutation Tests for Means, Medians, Proportions, the Correlation Coefficient and the Slope, and the Chi-Square Test for Independence. Modern statistical calculator for teachers and students of statistics. The Art of Stat: Resampling app lets you find bootstrap confidence intervals and permutation P-values. The app illustrates the procedures interactively so you can understand how they work. Several example datasets are preloaded for you to explore, but you can also enter your own data or import a CSV file. The following resampling methods are implemented: - Bootstrap Confidence Interval for a population mean, median, or standard deviation. - Bootstrap Confidence Interval for a population proportion or the population odds. - Bootstrap Confidence Interval for a population correlation (Pearson and Spearman) or the population slope of a regression model. - Bootstrap Confidence Interval for the difference of two population means or medians. - Permutation Test for a population mean or median. - Permutation Test for the difference of two population means or medians. - Permutation Test for the independence of two categorical variables (Permutation Chi-Squared Test) Easily find the bootstrap confidence interval based on the percentile and other methods. For inference about population means, compare results to traditional methods based on the Student-t distribution. For the Chi-squared test of independence, compare to the results from Pearson's Chi-squared test. Each procedure has three screens: 1) Enter Data on the first screen in various ways, and obtain descriptive statistics and corresponding graphs (Histogram, Boxplot, Bar Chart). 2) Generate the bootstrap or permutation distribution on the second screen, step-by-step, or 1,000 at a time. 3) Obtain the Bootstrap Confidence Interval or Permutation P-value on the third screen, along with lots of supporting information and comparison to classical, central-limit-based inference. The app comes with several example datasets pre-loaded, but you can also upload your own .CSV file or create one in the Data Editor. Easily share results by taking screenshots. Unlock all content for a one-time small fee!
Latest release
What’s New
- open files from Google Drive - load and display data faster
Audience growth
Ratings growth
Baseline captured. Growth appears after the crawler observes a changed rating count.
Momentum comes from crawler snapshots for the tracked storefront. “Viral growth signal” means unusually fast recent rating gains; it is an indicator, not download data.
Price tracking
Price intelligence
First snapshot captured. The trend line starts after the next crawler price observation.
- First observed Aug 19, 2026 · 8:25 AM Free
Screenshots