About this app
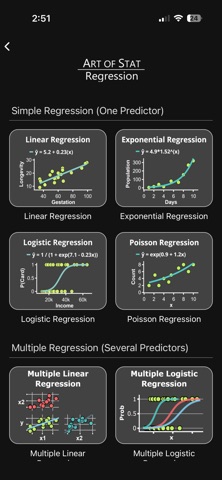
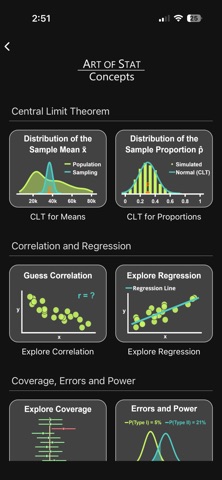
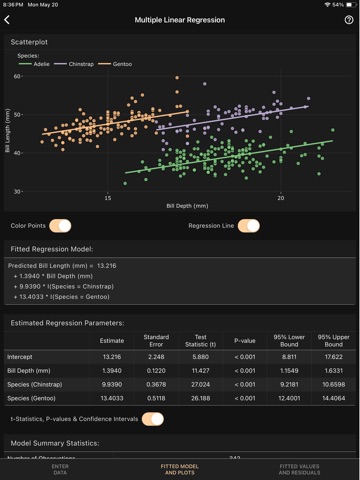
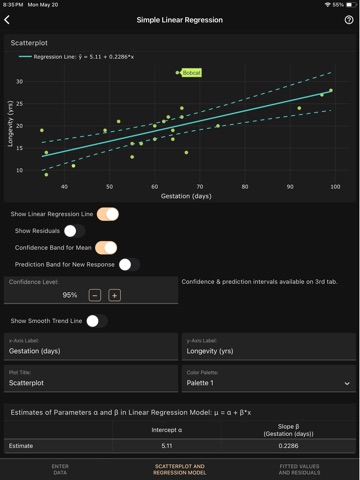
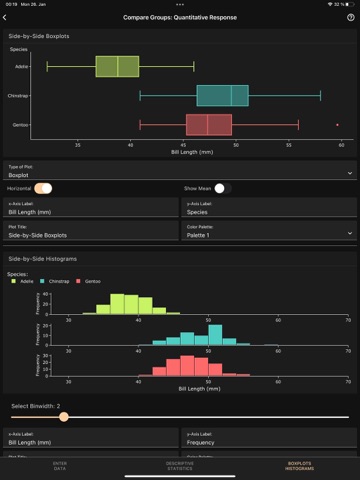
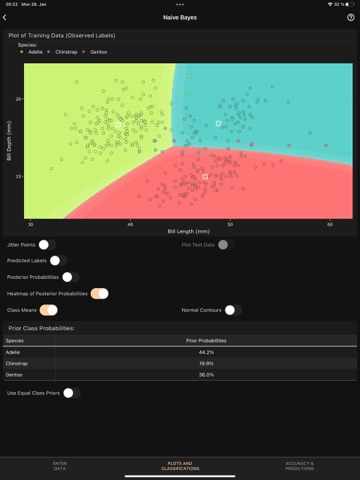
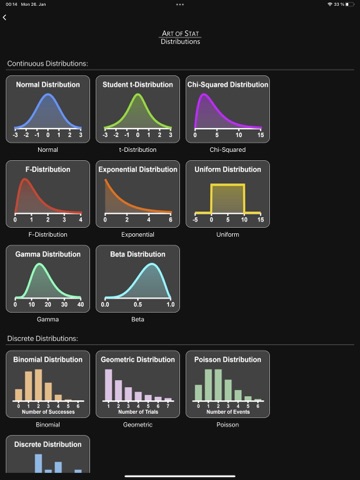
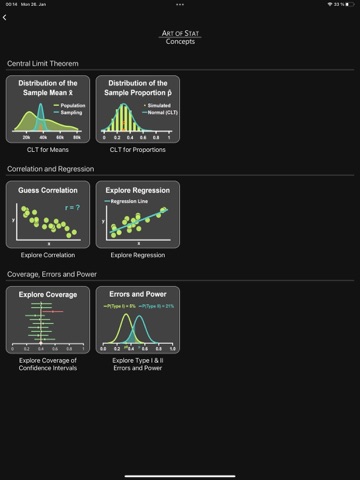
The Art of Stat app covers all your statistics needs—from core concepts and probability distributions to data exploration, inference, modeling, and prediction. Use pre‑implemented datasets, import your own CSV/Excel files or - for small datasets - provide them directly. Created by an expert college professor with many years of experience teaching Statistics & Data Science. Better than AI: a guided, step‑by‑step learning experience—from summary statistics and visualizations to understanding statistical methods and outputs, including stunning visualizations. (YouTube channel coming soon!) Try it free: 7‑day trial with no credit card or subscription required. The app includes seven modules: - EXPLORE DATA Summary statistics, contingency tables, correlations, and rich visualizations: bar/pie charts, histograms, boxplots (including side‑by‑side), dotplots, and interactive scatterplots with color‑by‑variable. - DISTRIBUTIONS Interactively explore probabilities and percentiles for key distributions (Normal, Student‑t, Binomial, and more). Includes simulation tools. - CONCEPTS Central Limit Theorem (means/proportions), correlation and regression, confidence‑interval coverage, and Type I/II errors with power visualization. - INFERENCE Confidence intervals and hypothesis tests for proportions and means (one/two samples, independent/dependent), Chi‑square tests, and ANOVA. - REGRESSION Simple, multiple, and logistic regression; inference for parameters (SEs, CIs, p‑values); predictions; and striking interaction visualizations. - MACHINE LEARNING Supervised and unsupervised methods with train/test split, visualizations, predictions, heatmaps, and accuracy metrics including confusion matrices. - RESAMPLING Bootstrap CIs and permutation tests for means, medians, proportions, correlation, slope, and Chi‑square independence. Includes a Data Editor if you want to to create your own, smaller datasets. Works offline — perfect for exams or low‑connectivity environments. The standard Apple Terms of Use (EULA) apply for any subscription offered in the app. Access the link below to obtain the EULA: https://www.apple.com/legal/internet-services/itunes/dev/stdeula/
Latest release
What’s New
- Light Theme - Machine Learning: K-Nearest Neighbors - Hypergeometric and negative binomial distribution
Audience growth
Ratings growth
Baseline captured. Growth appears after the crawler observes a changed rating count.
Momentum comes from crawler snapshots for the tracked storefront. “Viral growth signal” means unusually fast recent rating gains; it is an indicator, not download data.
Price tracking
Price intelligence
- First observed Aug 19, 2026 · 8:25 AM Free
Screenshots