About this app
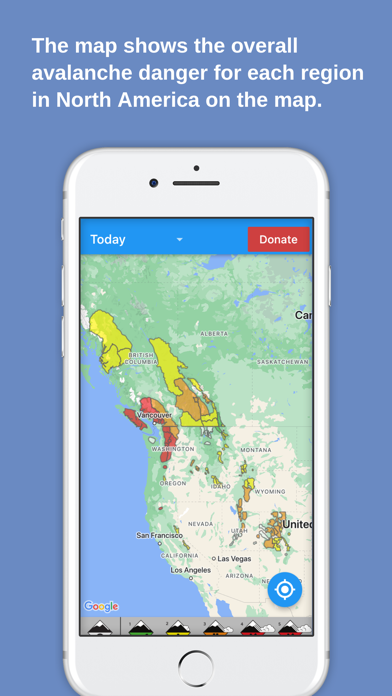
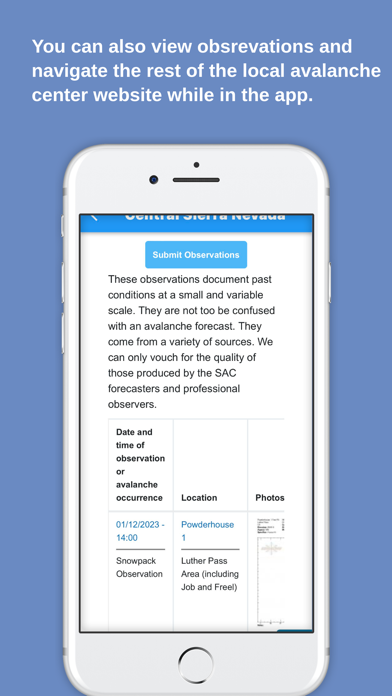
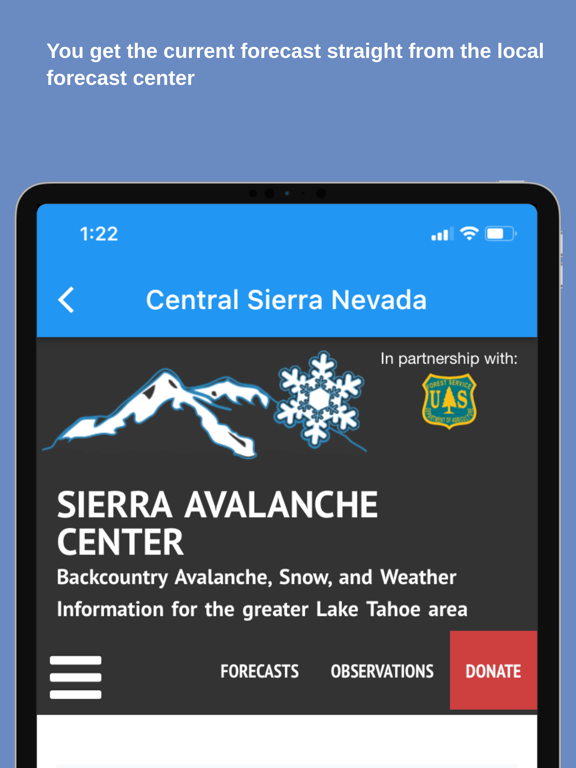
Get real-time updates on avalanche danger levels with Avalanche Forecasts. Our app makes it easy to see current danger levels at-a-glance for every forecast center in North America. Simply select your desired timeframe (Today/Tomorrow/2 Days Out) and view color-coded danger levels on the map. Click on any region to view the detailed avalanche forecast from the source forecasting center. With support for forecasts from over 20 centers, including NWAC (Northwest US), CAIC (Colorado), UAC (Utah), SAC (Central Sierras), ESAC (Eastern Sierras), MSAC (Mount Shasta), BAC (Bridgeport, CA), BTAC (Jackson Hole), GNFAC (Bozeman), WCMAC (Missoula), FAC (Kalispell/Whitefish), SNFAC (Sun Valley), IPAC (Idaho Panhandle), PAC (McCall), MWAC (Mount Washington), KPAC (Flagstaff), TAC (Taos), WAC (NE Oregon), CNFAIC (Chugach), JAC (Juneau), AAC (Anchorage), HAIC (Haines), VAC (Valdez), Cordova, HPAC (Hatcher Pass), Avalanche Canada, Parks Canada, WhistlerBlackcomb, VIAC (Vancouver Island), and Avalanche Quebec (Chic Chocs) forecasting centers, you can stay informed no matter where you are. For feature suggestions, bug reports, or other feedback, please contact us at project-development@sierraavalanchecenter.org.
Latest release
What’s New
Library updates.
Audience growth
Ratings growth
Baseline captured. Growth appears after the crawler observes a changed rating count.
Momentum comes from crawler snapshots for the tracked storefront. “Viral growth signal” means unusually fast recent rating gains; it is an indicator, not download data.
Price tracking
Price intelligence
First snapshot captured. The trend line starts after the next crawler price observation.
- First observed Aug 19, 2026 · 6:34 AM Free
Screenshots