About this app
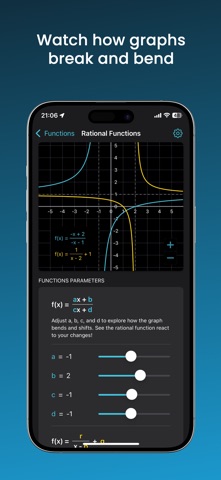
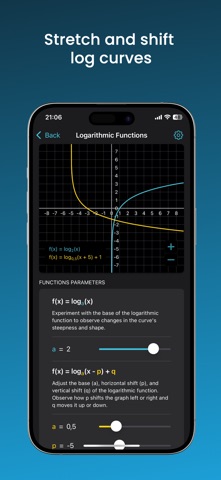
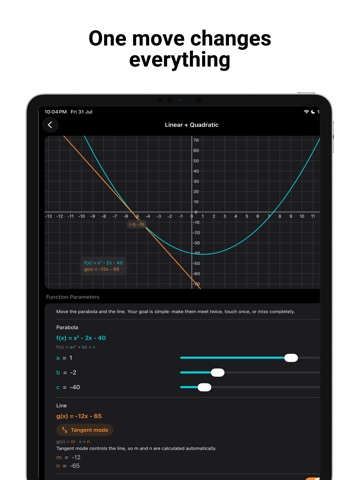
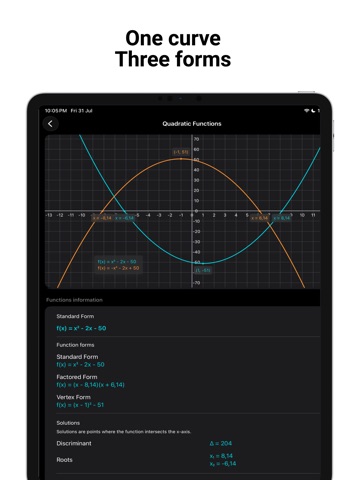
Functions make sense when you can see them. Beautiful Functions turns every change in an equation into an immediate change on the graph. Move a slider, watch the curve respond, and understand what each parameter actually does - before memorizing a rule or solving an exercise. NOT JUST A GRAPHING CALCULATOR This is a visual learning environment designed to show how functions work. Watch a line cross a parabola twice, become tangent, then miss it completely. See a function reflect into its inverse. Switch the same parabola between Standard, Vertex, and Factored forms. Change amplitude, frequency, and phase, and watch every wave transform. EXPLORE WITH PURPOSE Use roots, intercepts, vertices, symmetry, extrema, inflection points, and asymptotes as visual guides instead of isolated definitions. Collapse the graph when you want to focus on an explanation, then bring it back to test your intuition. START FREE Start with Linear, Quadratic, Cubic, and Logarithmic Functions. Pro unlocks: • Linear + Quadratic • Exponential Functions • Trigonometric Functions • Function Transformations • Rational Functions • Absolute Value Functions • Inverse functions and slope relationships • Vertex and Factored form editing One-time purchase unlocks every Pro screen and feature. No subscription. Built for high school and university students, teachers, tutors, parents, and anyone who wants to understand functions instead of memorizing them. Download Beautiful Functions and see what equations mean.
Latest release
What’s New
Beautiful Functions 2.0 is a complete relaunch - redesigned around one goal: making functions easier to see and understand. What’s new: • A completely redesigned menu, interface, graphs, formulas, and learning cards • New Linear + Quadratic screen with intersections, tangency, and h(x) = f(x) − g(x) • New Exponential Functions screen for growth, decay, shifts, roots, and asymptotes • Inverse functions plus parallel and perpendicular slope relationships • Direct parabola editing in Standard, Vertex, and Factored forms • Clearer explanations, expanded visual helpers, and collapsible graphs throughout This is the biggest Beautiful Functions update yet.
Audience growth
Ratings growth
Baseline captured. Growth appears after the crawler observes a changed rating count.
Momentum comes from crawler snapshots for the tracked storefront. “Viral growth signal” means unusually fast recent rating gains; it is an indicator, not download data.
Price tracking
Price intelligence
First snapshot captured. The trend line starts after the next crawler price observation.
- First observed Sep 6, 2026 · 12:26 PM Free
Screenshots