About this app
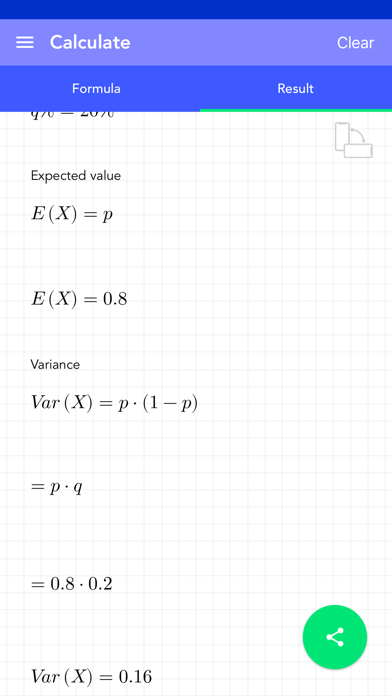
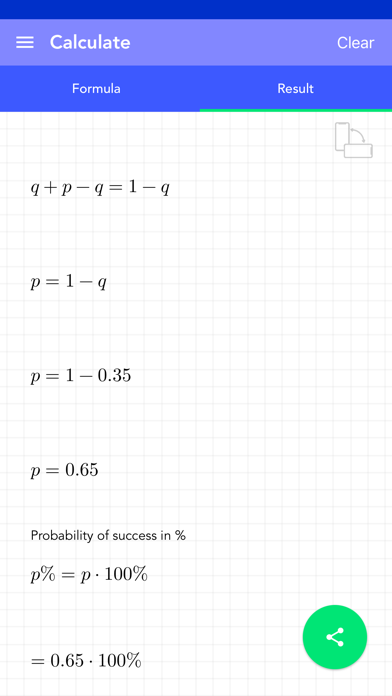
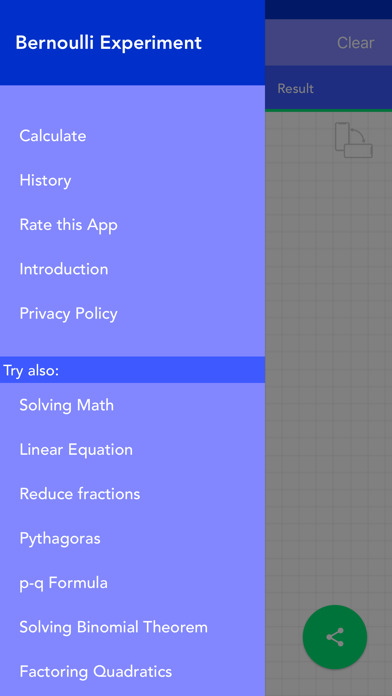
This app calculates the probability of success and failure, the expected value, variance, standard deviation and the Bernoulli distribution. It also shows the Bernoulli distribution as histogram and distribution function chart. There are two modes that defines your starting point of the calculation. Either you have certain amounts of successes and failures or a probability of each. Depending on the mode, natural numbers or decimal numbers are supported. The solution is shown step by step. All calculations are stored in the history. The final solution can be shared. [ Contents ] - modes for all important values of a Bernoulli experiment - for mode 1, success and failure must be entered - for mode 2, p or q must be entered - results are calculated and shown in detail - histogram and distribution function graphs - history function to save the input - detailed solution - natural or decimal numbers are supported - no ads! [ Usage ] - there are fields for entering values using a special keyboard - press the check mark button at the bottom right to start the calculation - if values are missing, the corresponding field is highlighted in yellow - if the values are incorrect, the affected field will be highlighted in red - a short message explains why a value is incorrect - the entries in the history can be deleted or sorted - if you select an entry in the history, it will be automatically loaded for the calculation - the whole history can be deleted by pressing a button - solutions can be shared - p and q must be greater than 0 and less than 1
Latest release
What’s New
The latest release 'Least common multiple' is linked in the menu section now. Minor performance and UI fixes.
Audience growth
Ratings growth
Baseline captured. Growth appears after the crawler observes a changed rating count.
Momentum comes from crawler snapshots for the tracked storefront. “Viral growth signal” means unusually fast recent rating gains; it is an indicator, not download data.
Price tracking
Price intelligence
- Price decreased Sep 16, 2026 · 1:13 PM Free from 1.99
- First observed Aug 27, 2026 · 4:48 AM $1.99
Screenshots