About this app
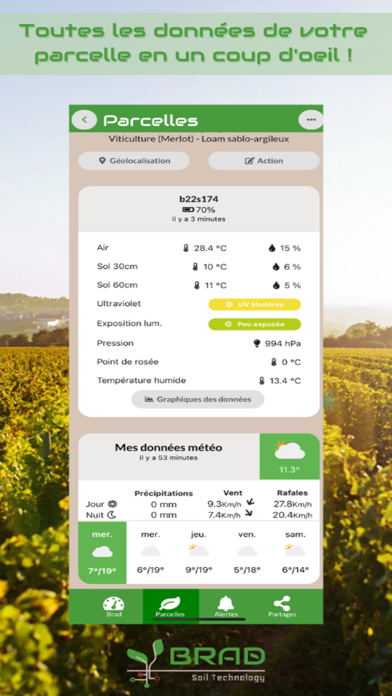
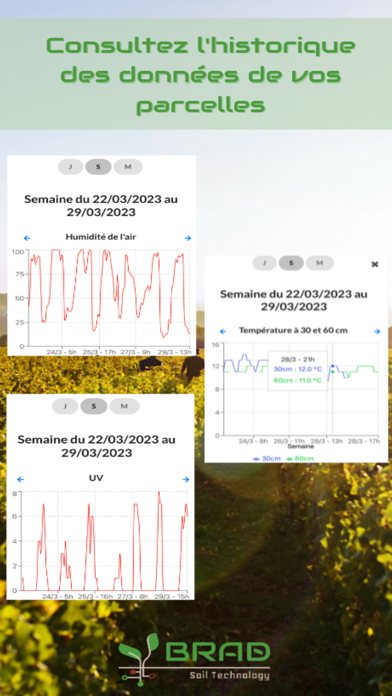
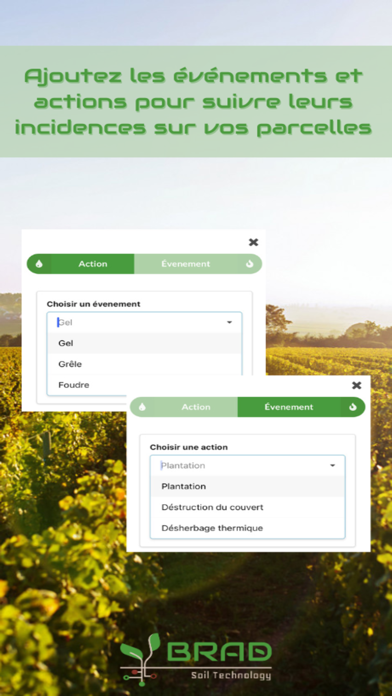
Using the Brad application makes it possible to anticipate risks and opportunities to produce better, to limit inputs, with less waste and at a lower cost. With the Brad app, you can: - Consult in real time the environmental conditions of your plots thanks to the data collected by the Brad probe. - Be notified of weather risks. - Get up to five days of forecast allowing you to better organize your actions and focus on the essentials. How it works ? 1. The application receives the data collected every hour by a probe deployed on your plot, 2. You can use the pre-configured alerts or create your own, (type: temperature at 30 cm below 0° and humidity below 70 %), 3. When a pre-determined threshold is reached, you receive a notification. Alerts can be received by SMS, email and notifications on mobile or tablet, 4. Forewarned, you will have more time to avoid diseases or meet the needs of your farm. If you don't have a probe, you can create an account and test with a test probe that will be assigned to you when creating your account. Features: Data imported by the probe and analyzed by the app: - Relative soil humidity at 2 levels: 30 cm and 60 cm deep - Relative air humidity - Soil temperature at 2 levels: 30cm and 60cm deep - Air temperature - Atmospheric pressure - Luminosity: visible and ultraviolet spectrum - Dew point (calculated) Details of Third Party Data: - 5-day weather forecast, - Wind: speed, direction, intensity, - Rainfall Brad's solution allows you to collaborate with your team, your consultant or your community: - Add members of your team and/or your adviser to share your farm data. - Share your data with other farmers - Receive data from other farmers Probe data can be retrieved via API or CSV export.
Latest release
What’s New
Update app icon
Audience growth
Ratings growth
Baseline captured. Growth appears after the crawler observes a changed rating count.
Momentum comes from crawler snapshots for the tracked storefront. “Viral growth signal” means unusually fast recent rating gains; it is an indicator, not download data.
Price tracking
Price intelligence
First snapshot captured. The trend line starts after the next crawler price observation.
- First observed Aug 19, 2026 · 6:14 AM Free
Screenshots