About this app
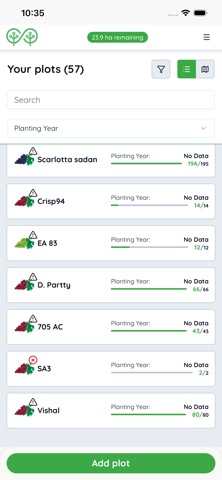
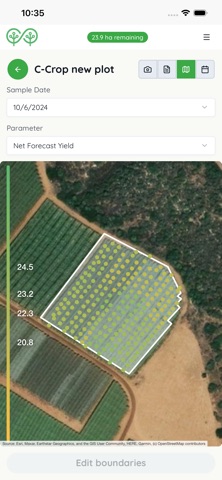
C-Grape helps vineyard managers and farmers make data-driven decisions with AI-powered grape analysis. HOW IT WORKS Simply record short video samples of your vineyard rows. C-Grape's computer vision technology automatically analyzes the footage and extracts key metrics about your grape clusters. KEY INSIGHTS • Cluster Density — Average clusters per meter along your vine rows • Cluster Size — Measure average cluster length across plots • Berry Count — Estimated berries per cluster • Berry Size — Average berry diameter in millimeters FEATURES • Quick video sampling with guided recording • GPS-tagged samples for precise plot mapping • Compare metrics across different plots and grape varieties • Track seasonal changes with historical analytics • Yield estimation based on cluster data DESIGNED FOR VITICULTURE Built specifically for wine grape and table grape growers. Whether you manage a single vineyard or multiple properties, C-Grape gives you the quantitative data you need to optimize canopy management, forecast yields, and plan harvest timing. SIMPLE WORKFLOW 1. Select your plot on the map 2. Record a video sample walking along the row 3. Upload and receive analysis results 4. Compare and track over time RECOMMENDED DEVICES • iPhone 13 or newer • For challenging lighting: iPhone 15 or 16 recommended Developed by C-Crop — precision agriculture technology for viticulture.
Latest release
What’s New
• Buy sampling credit when you need it — no annual commitment. Pay about per sample. • The screen now stays on while auto-recording, so a screen timeout no longer interrupts a walk. • Lower battery use and less heat during long sampling sessions. • You can resize a plot boundary after it has been sampled. • A clearer pricing page.
Audience growth
Ratings growth
Baseline captured. Growth appears after the crawler observes a changed rating count.
Momentum comes from crawler snapshots for the tracked storefront. “Viral growth signal” means unusually fast recent rating gains; it is an indicator, not download data.
Price tracking
Price intelligence
First snapshot captured. The trend line starts after the next crawler price observation.
- First observed Aug 20, 2026 · 12:20 AM Free
Screenshots