About this app
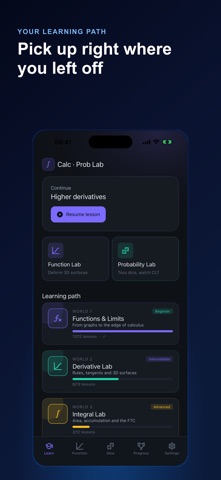
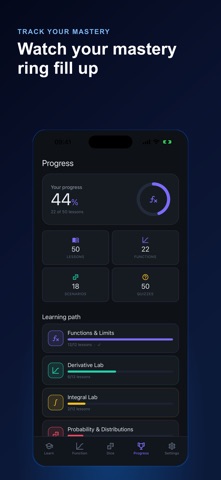
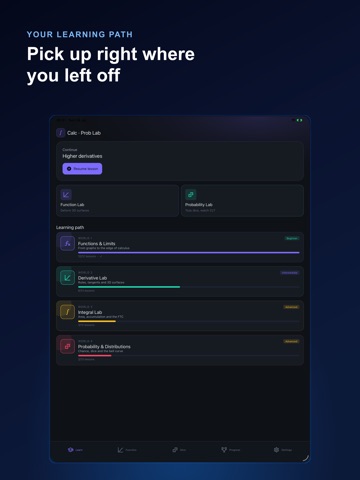
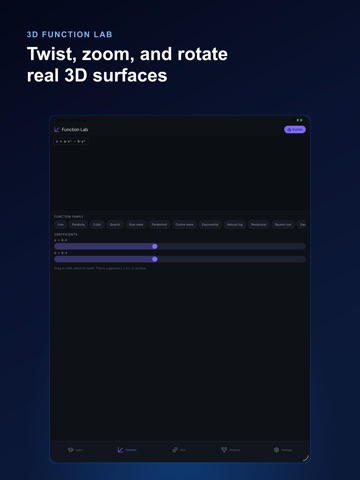
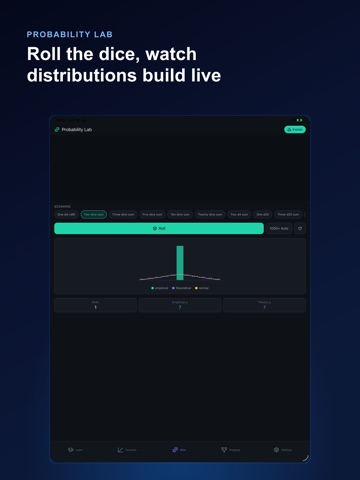
Calculus & Probability Lab turns two of the hardest STEM subjects into something you can see, touch, and drag with your finger. Instead of static graphs in a textbook, every derivative, integral, and probability distribution becomes a real 3D object you orbit, zoom, and reshape live. Whether you're in AP Calculus, a first-year college calculus or statistics course, or just relearning math you forgot, this app trades memorized formulas for visual intuition: drag a point along a curve and watch its tangent-line slope update instantly, or watch a histogram built from real dice tosses close in on the bell curve as you roll. FUNCTION LAB — 3D VISUALIZER • 22 function families: lines, parabolas, cubics, quartics, sine/cosine waves, exponentials, natural logs, reciprocals, square roots, Gaussian bumps, logistic S-curves • Genuine z = f(x, y) surfaces — paraboloids, saddles, Gaussian hills, ripples, sphere caps, cones, tilted planes, monkey saddles, egg-carton surfaces, twin peaks — drag to orbit, pinch to zoom • Live tangent-line overlay — move a point along any curve and watch the exact derivative f'(x) recompute in real time • Riemann sum overlay — slide from 1 to 60 rectangles and watch the sum converge to the exact definite integral • Every formula is closed-form and exact — no approximation, no drift PROBABILITY LAB — PHYSICS DICE • Toss physics-simulated dice and build a genuine empirical histogram, roll after roll • Scenarios span dice-sum outcomes, coin-flip binomial trials, and Poisson arrival processes • Overlay your empirical results against the exact theoretical distribution on the same chart • Watch the Central Limit Theorem happen live: enough trials and the histogram closes in on the normal curve • Track empirical mean against theoretical mean at every roll LEARNING PATH — 4 WORLDS, ~50 LESSONS • World 1, Functions & Limits: what a function is, families of functions, slope, one- and two-sided limits, continuity, average vs. instantaneous rate of change, exponentials and logs • World 2, Derivative Lab: the derivative as slope, power/product/quotient/chain rules, higher derivatives, tangent planes and partial derivatives, critical points, related rates, optimization, the Mean Value Theorem • World 3, Integral Lab: area under a curve, Riemann sums, the definite integral, antiderivatives, the Fundamental Theorem of Calculus, net change, average value, area between curves, volumes of revolution, improper and numerical integration • World 4, Probability & Distributions: sample space and events, combining probabilities, the two-dice sum, random variables, expected value, binomial and Poisson models, the normal curve • Every lesson deep-links straight into the matching 3D lab, so theory and visualization reinforce each other AI TUTOR • Tap Explain on any surface, formula, or dice distribution and get a plain-language breakdown of exactly what's in front of you — your specific coefficients, your specific slope, your specific mean and standard deviation, not a generic textbook definition BUILT FOR REAL STUDY, NOT JUST BROWSING • Progress tracking across every world and lesson, so you always know where you left off • A limited number of dice rolls each day on the free tier; upgrade to roll without limits, unlock every function family and 3D surface, every lesson, and the AI tutor • A clean, dark, distraction-free interface built for a late-night study session, not a cluttered graphing-calculator UI • Monthly and Annual plans, with a 3-day trial on Annual — cancel anytime in your account settings Calculus and probability are usually taught as two separate walls of formulas to memorize before an exam. Calculus & Probability Lab treats them as one connected, visual subject — build the intuition once, and the formulas stop needing to be memorized at all. Terms of Use https://www.apple.com/legal/internet-services/itunes/dev/stdeula/ Privacy Policy https://coddykit.com/terms/privacy-policy
Audience growth
Ratings growth
Baseline captured. Growth appears after the crawler observes a changed rating count.
Momentum comes from crawler snapshots for the tracked storefront. “Viral growth signal” means unusually fast recent rating gains; it is an indicator, not download data.
Price tracking
Price intelligence
First snapshot captured. The trend line starts after the next crawler price observation.
- First observed Sep 20, 2026 · 3:25 AM Free
Screenshots