About this app
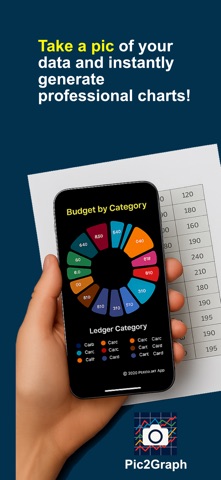
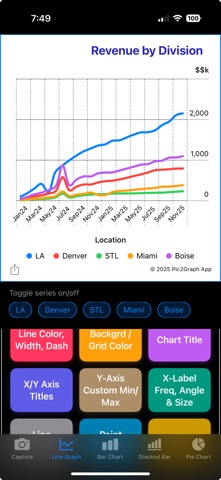
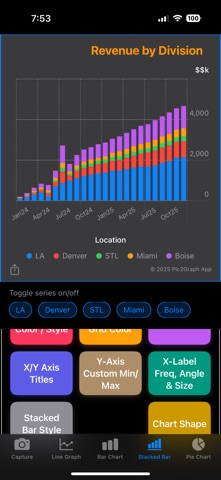
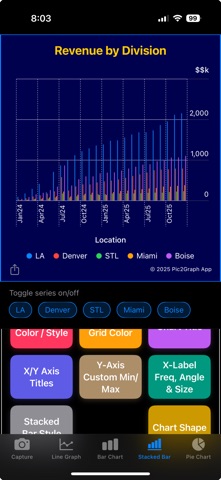
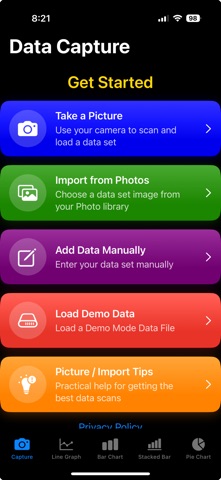
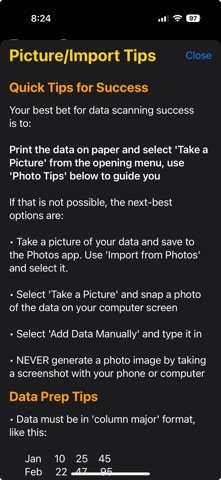
Pic2Graph turns tables of numbers into professional charts in seconds—no subscriptions, no hidden costs. Simply scan data from a photo or screenshot, and instantly create bar, line, pie, or stacked charts ready to insert into presentations, reports, and more. It’s the simple spreadsheet alternative for anyone who wants clean, customizable charts without spreadsheet hassles. Pic2Graph is designed to take the mystery out of creating professional-grade charts. If manipulating multiple spreadsheet menus is not your area of expertise, you can use Pic2Graph to bypass the hassle and create custom charts in seconds. One tool lets you capture data, and generate Line Charts, Bar Charts, Stacked Bar Charts, and Pie Charts instantly. You can go from taking a picture of your data to having all four charts in under 10 seconds. Once the data is imported you can then modify the charts to your liking in dozens of ways. Charts will display up to 5 separate data rows simultaneously, with free tunable adjustments for color, border, backgrounds and title/axis labels. The Pro Upgrade expands customization with more data, more colors, color palettes, line width and dashing, grid colors, min/max y-axis settings, x-axis stride/angle/font size, line smoothing, point symbols, stacked and grouped-style bar charts, various pie and donut slice shapes, slice labeling, and legend on-off. With Pro, you also can select the shape of your output to match your final presentation--horizontal, square, or vertical. Finally, simply long-press the chart to generate a .jpeg image and Copy, Save, or Share. You can insert the generated charts directly into a document or presentation. You can go from a data table of numbers to inserting a stacked bar chart into your presentation in under a minute!
Latest release
What’s New
Updated App Store description and metadata to improve discoverability.
Audience growth
Ratings growth
Baseline captured. Growth appears after the crawler observes a changed rating count.
Momentum comes from crawler snapshots for the tracked storefront. “Viral growth signal” means unusually fast recent rating gains; it is an indicator, not download data.
Price tracking
Price intelligence
First snapshot captured. The trend line starts after the next crawler price observation.
- First observed Aug 21, 2026 · 11:43 AM Free
Screenshots