About this app
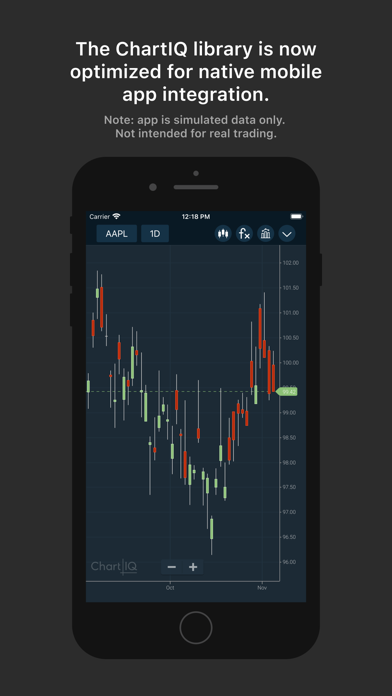
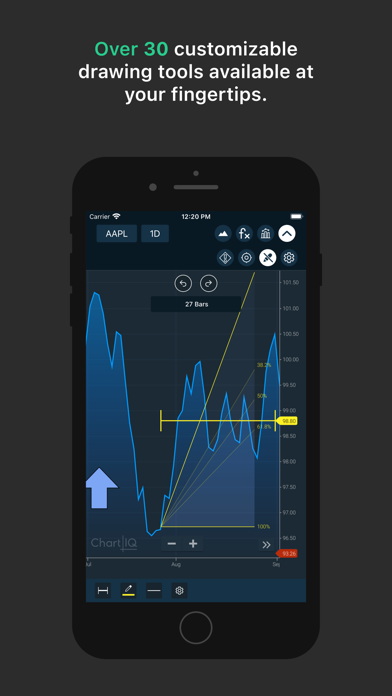
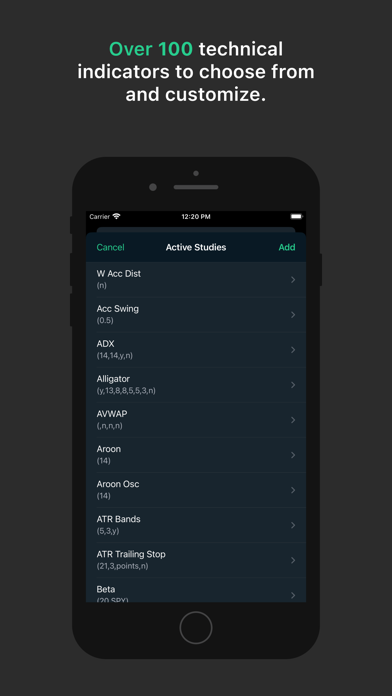
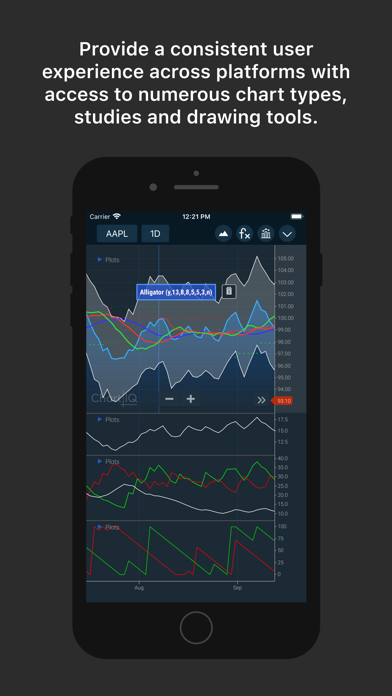
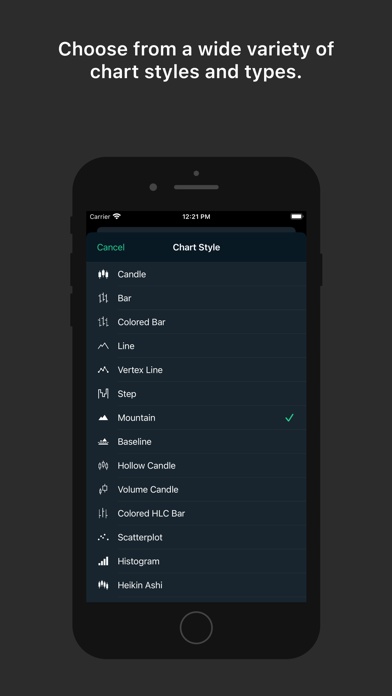
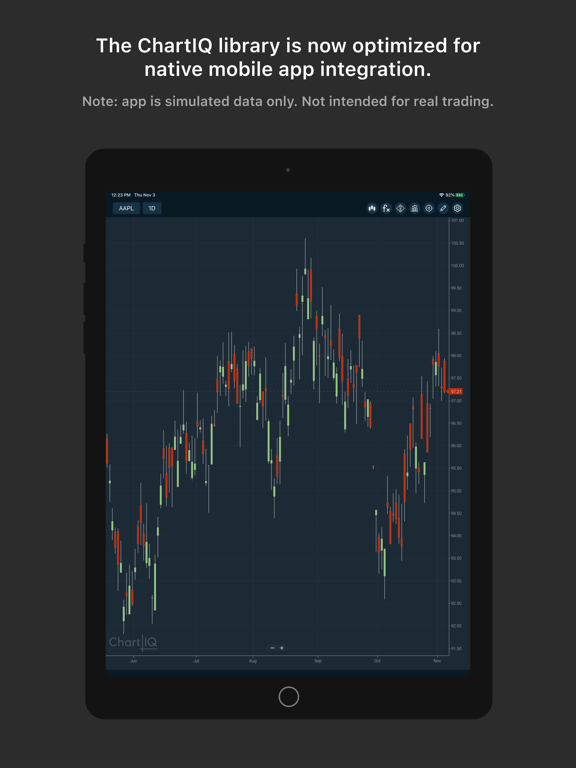
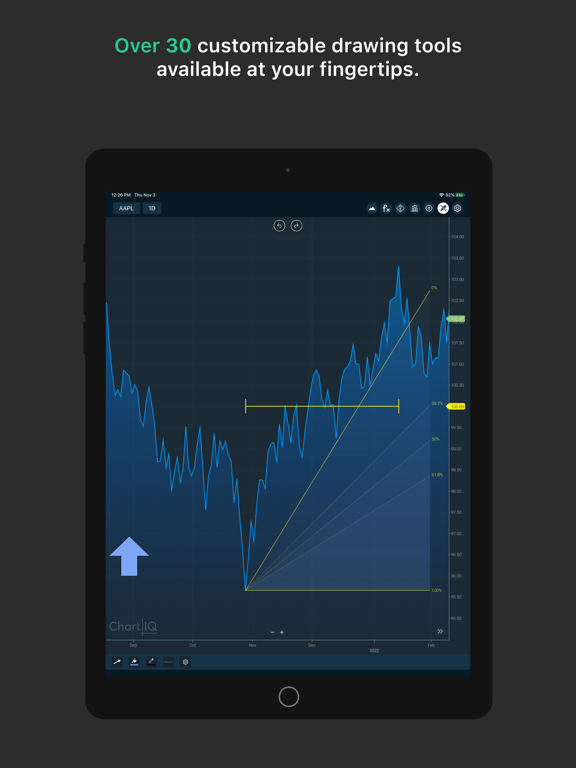
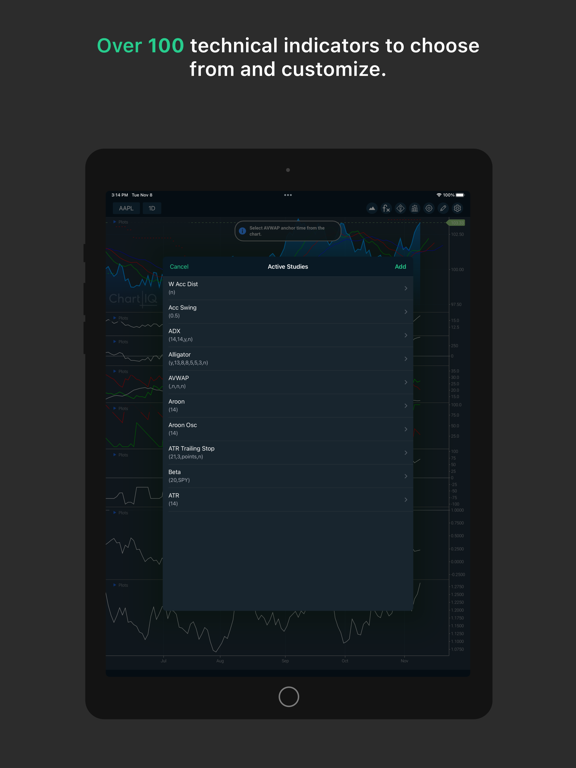
ChartIQ - The World's Most Powerful HTML5 Charts. Install our mobile chart simulator to test drive our native mobile app experience! The ChartIQ Difference ChartIQ is the first and only professional grade HTML5 Charting Library solution that works seamlessly on any platform (mobile, web, desktop) or framework (Angular, React, Vue) using a single library. It is pure JavaScript and runs entirely within a browser or web view with native controls. Most companies have at least one financial charting library for each platform or application they target—web, C#, Java, mobile OS's, etc. which means developers have multiple code bases to maintain. With ChartIQ, write your code once and use it everywhere. A Robust Software Development Kit (SDK) ChartIQ is essentially an infrastructure toolkit, carefully thought through and built to give you unparalleled flexibility while maintaining ease of integration. Our clients love how quickly they get up and running with our charting library: a complete SDK with comprehensive APIs, production-grade “drop-in” UI templates, sample implementations, optional add-on modules, and extensive documentation. This allows software developers to integrate charts into their applications within minutes.
Latest release
What’s New
Update to the latest version of the ChartIQ Charting SDK.
Audience growth
Ratings growth
Baseline captured. Growth appears after the crawler observes a changed rating count.
Momentum comes from crawler snapshots for the tracked storefront. “Viral growth signal” means unusually fast recent rating gains; it is an indicator, not download data.
Price tracking
Price intelligence
First snapshot captured. The trend line starts after the next crawler price observation.
- First observed Aug 31, 2026 · 7:28 AM Free
Screenshots